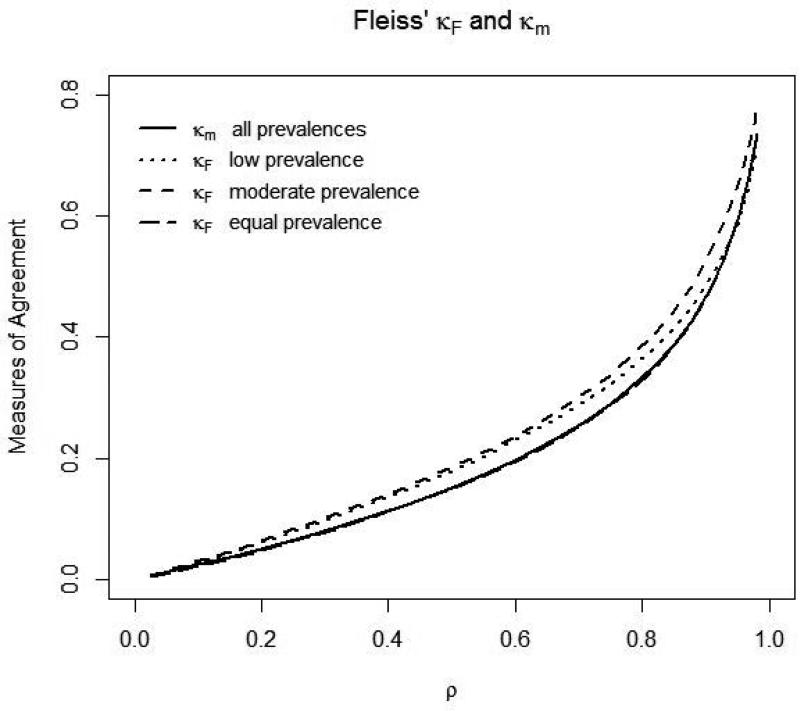
Figure (i).
Plots of agreement measures, proposed κm and κF versus ρ for varying prevalence (extreme low or high, moderate, equal in each category; the percent of observations falling into each of the Ci categories, i=1,...,5 in each prevalence case are presented in Table 2) with σ2v set to 1 and σ2u increasing in value.

