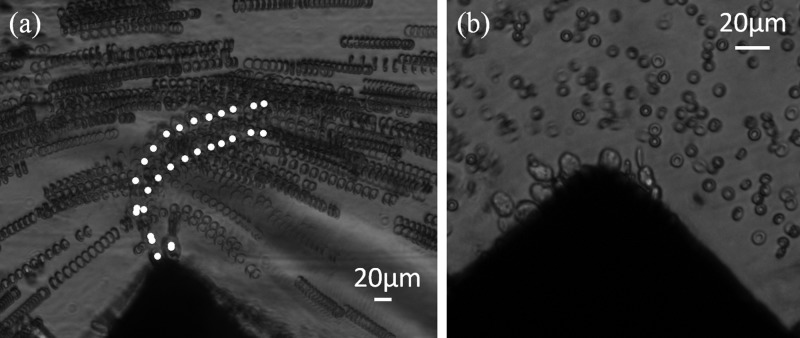
FIG. 8.
Illustration of MDA-MB-231 DEP isolation (1 kV/cm at 90 kHz for 1 to 5 μl/h) from RBC sample for a CTCs concentration ratio of 1:10. (a) Time-lapse stacking: centers of mass of MDA-MB-231 are labeled in white; (b) picture of MDA-MB-231 cells that were trapped on the electrode tip, whereas RBC were not.

