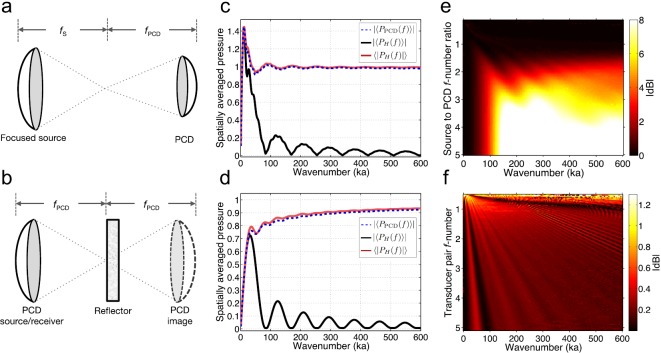
Fig. 1.
(Color online) (a) Representative configuration of the pitch-catch technique employing a confocal transducer pair of unequal geometry with source focal length and PCD focal length . (b) Corresponding configuration of the pulse-echo technique employing a reflector and image source. (c) Simulated pressure spatially averaged over a concave PCD surface, , pressure averaged over a planar hydrophone measurement surface, , and pressure magnitude averaged over the same planar surface, . Pressures are plotted normalized to the nominal surface pressure amplitude of the source as a function of ka for a pitch-catch transducer pair with respective f-numbers of 1.32 and 3.35. (d) Corresponding simulated, spatially averaged pressures for an equal-geometry pitch-catch transducer pair with f-number 3.35. (e) Decibel-scaled ratios of to for unequal transmit-receive transducer pairs representing the pitch-catch technique. (f) Corresponding pressure magnitude ratios for matched transducer pairs representing the pulse-echo technique.

