
Fig. 3.
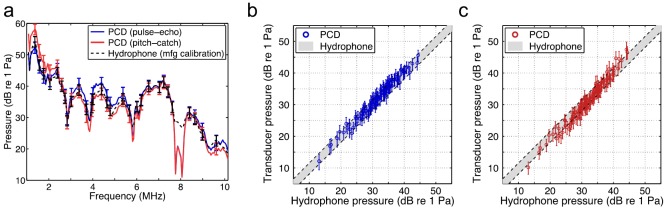
(Color online) (a) Representative frequency-dependent pressures measured by the hydrophone and PCD, with error bars representing their calculated uncertainty. (b) PCD-measured pressures and uncertainties using the receive sensitivity determined using the pulse-echo technique vs corresponding hydrophone-measured pressures. (c) PCD-measured pressures and uncertainties using the receive sensitivity determined using the pitch-catch technique vs corresponding hydrophone-measured pressures. Dashed lines in (b) and (c) indicate the average hydrophone uncertainty above and below the one-to-one line.