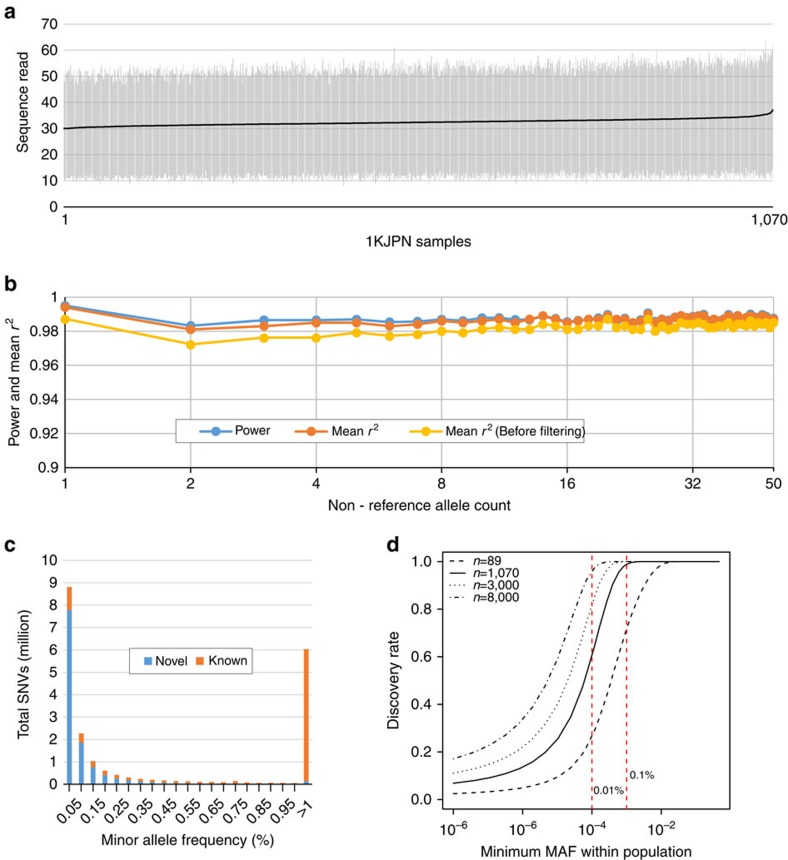
Figure 1. SNVs in 1KJPN.
(a) Statistics on read depth in 1KJPN. The vertical bars indicate the minimum and maximum depth of the number of sequence reads on each individual after filtering. They were sorted according to the average sequenced read depth (the black line). (b) The plot shows the power to detect SNVs (blue) of the confidence SNVs and the mean r2 values before (yellow) and after (orange) filtering with SNP array data for the same sample on non-reference allele counts ranging from 1 to 50. The r2 between genotypes from the SNVs in 1KJPN and the SNP array data is given by the squared Pearson correlation. (c) The numbers of novel and known SNVs in each MAF bin. The novel SNV frequency begins to dominate for lower MAFs. (d) The rate of variant discovery by minimum MAF in the 1KJPN population. The rates of variant discovery in our sequencing strategy were plotted against minimum MAF in the 1KJPN population by different sampling size. The distribution of population MAF was estimated on the basis of the demographic model shown in Supplementary Fig. 3.

