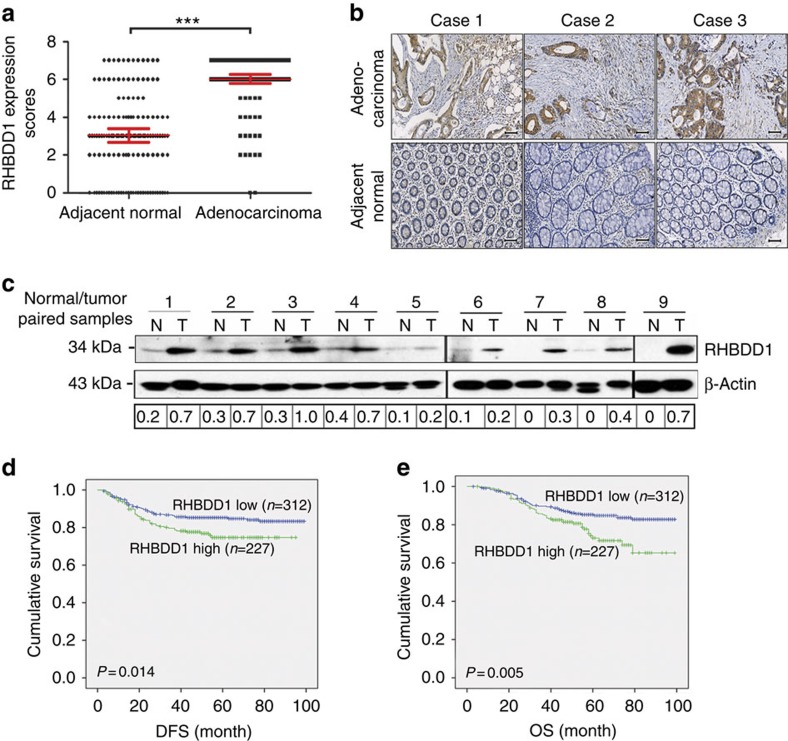
Figure 1. RHBDD1 expression in specimens from CRC patients.
(a) Tissue microarray data analysis of RHBDD1 expression in 142 CRC patients. The data are presented as means±s.d., N=142, the Wilcoxon signed rank test, ***P<0.001. (b) Representative immunohistochemical staining of RHBDD1 on tissue microarrays containing CRC tissues and adjacent normal tissues (scale bar, 50 μm). (c) Expression of RHBDD1 in CRC patients was analysed by western blotting using β-actin as a loading control. (d) and (e) Kaplan–Meier survival analysis of the correlation between RHBDD1 expression and disease-free and overall survival in 539 CRC patients (N=539, the Kaplan–Meier method with log-rank testing, DFS: P=0.014; OS: P=0.005).

