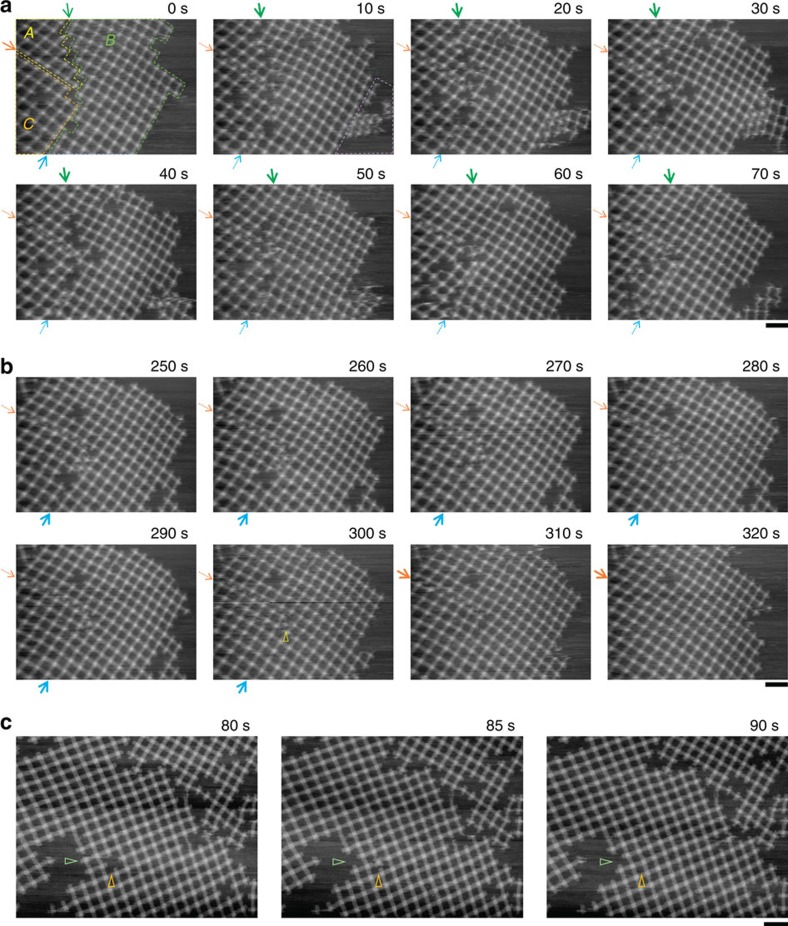
Figure 3. Processes of lattice formation.
Time-lapse images of growing lattices on the SLB surface were obtained at 0.2 frames per s. (a,b) Lattice fusions. The elapsed time is shown in each image. In the initial frame of the consecutive images, three lattices named A (red framed), B (blue framed) and C (yellow framed) were observed in the scanning area. (a) Fusion of lattices A and B. (b) Fusion of lattices B and C. Gaps between lattices A and B, B and C, and C and A are indicated by green, blue and orange arrows, respectively. Association-and-dissociation-coupled reorganization was also observed at the right boundary of lattice B (dashed purple area). Excess units between the B and C boundaries were desorbed away to allow a complete connection (yellow triangle). Details are seen in Supplementary Movie 1. (c) Defect filling. The elapsed time is shown in each image. The point defect (orange triangle) was filled with the monomer came from the lattice edge (green triangle). Details are seen in Supplementary Movie 2. Scale bars, 200 nm.

