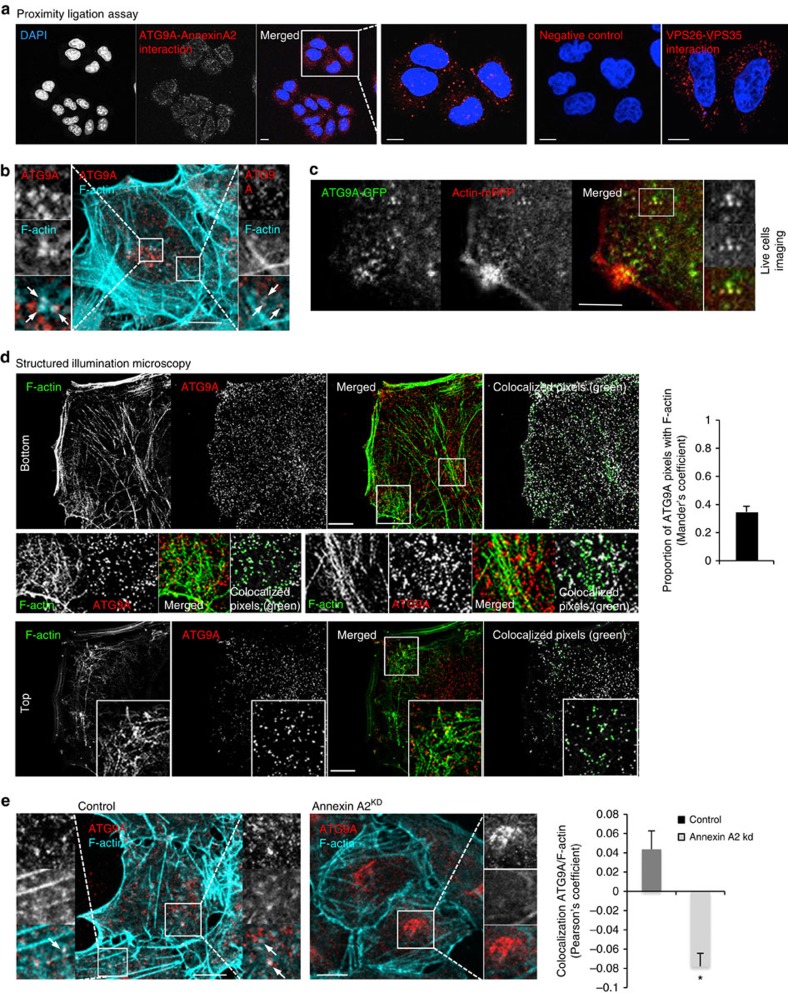
Figure 2. Annexin A2 regulates ATG9A and actin colocalization.
(a) HeLa cells were fixed and analysed using the Proximity Ligation Assay, with primary antibodies as indicated. The cells were imaged by confocal microscopy. Scale bars, 5 μm. (b) Colocalization between ATG9A and F-actin in HeLa cells. Confocal pictures showing colocalization between endogenous ATG9A and F-actin (using Phalloidin staining) are presented. Magnified areas are shown with arrows indicating actin patches around ATG9A vesicles. Scale bars, 5 μm. (c) Colocalization between ATG9A and actin in live cells. Confocal pictures showing colocalization between endogenous ATG9A and actin (using actin-mRFP) are presented. Magnified areas are presented showing ATG9A and actin colocalization. Scale bars, 5 μm. See Supplementary Movie 1. (d) Colocalization between ATG9A and F-actin by structured illumination super-resolution microscopy. Cells were fixed, immunostained for endogenous ATG9A and F-actin using Phalloidin conjugated to Alexa555 and subjected to structured illumination microscopy. Top and bottom show slices through the top and bottom of the cells, respectively. Colocalized pixels are shown in green on the right of each panel using ImageJ. Colocalization between ATG9A and F-actin is shown as Manders' coefficient representing the number of ATG9A pixel colocalizing with F-actin pixels. Data are mean ± s.e.m. Scale bars, 5 μm. (e) Colocalization between ATG9A and F-actin (using Phalloidin staining) in Annexin A2 knockdown cells. Confocal pictures are presented with magnified areas showing the colocalization between ATG9A and F-actin in control cells and a decreased colocalization in Annexin A2 knockdown cells. Scale bars, 5 μm. Data are Pearson's coefficient as mean ± s.e.m. (n≥20 cells; *P<0.05; two tail t-test).

