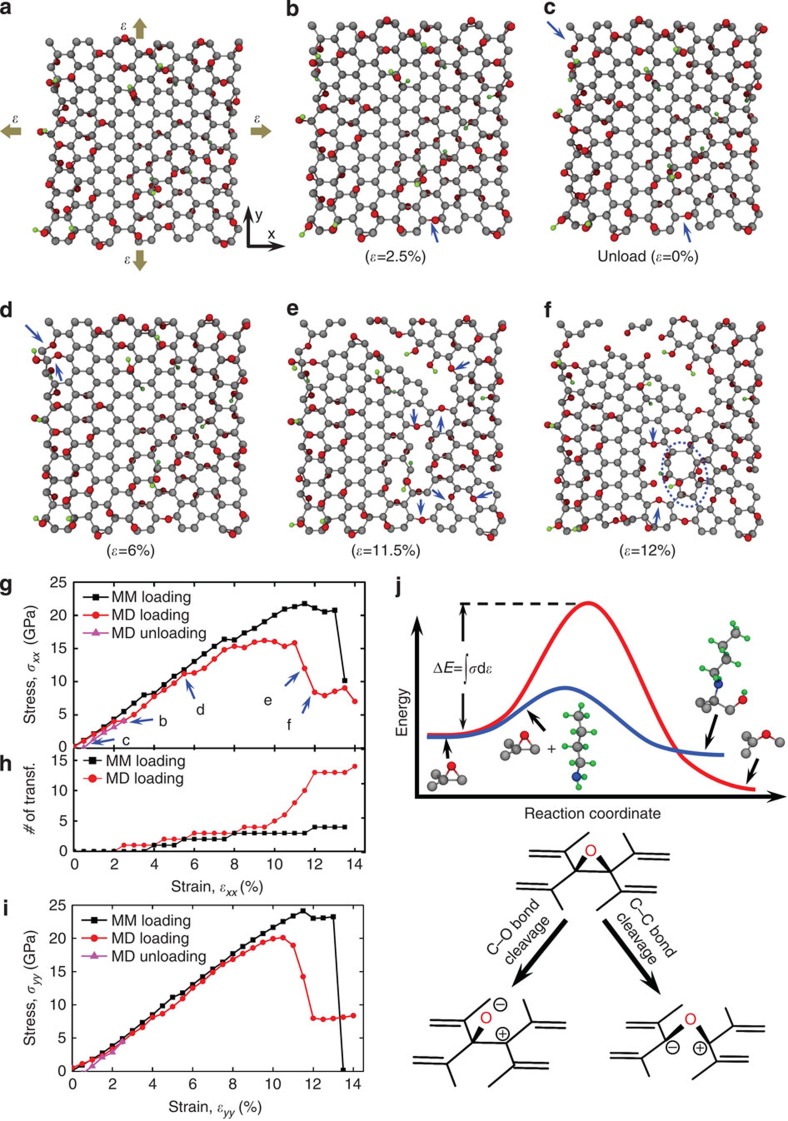
Figure 2. Density functional-based tight-binding modelling.
Modelling of a 1.988 × 2.091 nm2 GO sheet (ϕ=0.7) being subjected to equibiaxial tension (a–f). (a) The initial configuration of the GO sheet and the schematic of the constraints. Grey, red and green beads represent carbon, oxygen and hydrogen atoms, respectively. (b–f) The snapshots of the deformed GO sheet during molecular dynamics (MD) simulations. The dark-blue arrows highlight the locations on each snapshot where epoxide-to-ether transformations occurred. The dashed circle in snapshot IV highlights a Stone–Wales defect. (g) Stress–strain curves in the armchair direction (x axis in a) obtained from molecular mechanics and MD simulations. Labels in stress–strain curve refer to MD snapshot panels in this figure. (h) Accumulated number of epoxide-to-ether transformations as a function of strain. (i) Stress–strain curves along the zigzag direction (y axis in a). (j) An illustration of the relative energetic difference between the mechanochemically induced epoxide-to-ether transformation activated by strain energy (that is, C–C bond cleavage, red profile) and the epoxide ring-opening by n-butylamine (that is, C–O bond cleavage, blue profile). Grey, red, green and blue beads represent carbon, oxygen, hydrogen and nitrogen atoms, respectively. The chemical drawings beneath the profiles are included only to illustrate the key differences between the two chemical pathways without including all the relevant species (water, n-butylamine and so on) that can be involved to facilitate the transformations. As such, the formal charges that are indicated on the drawings should not be taken literally.

