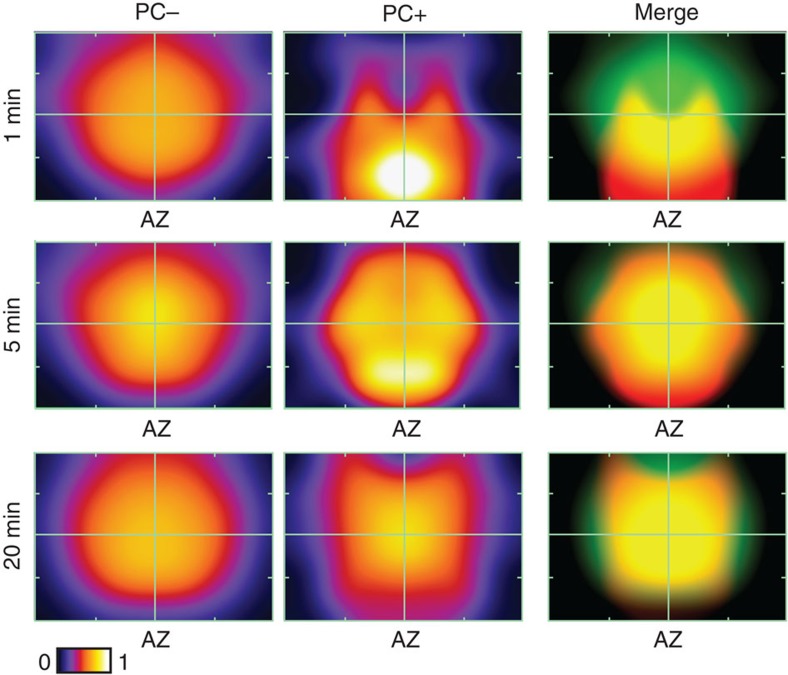
Figure 3. Vesicles retrieved after RRP stimulation recycle to random positions in the terminal.
Normalized and smoothed spatial frequency density plots for the three time points (1, 5 and 20 min, n=73 PC+ vesicles from 28 synapses from 3 slices, n=138 PC+ vesicles from 59 synapses from 3 slices, n=455 PC+ vesicles from 100 synapses from 5 slices) for PC− (left panels), PC+ (middle panels) and merged (right panels) showing the positions occupied by vesicles with respect to the active zone and cluster boundaries. Active zone centres (AZ) are at the bottom middle in each plot. In merged plots, green corresponds to PC− and red to PC+ vesicles. See Supplementary Fig. 2 for approach used to generate plots.

