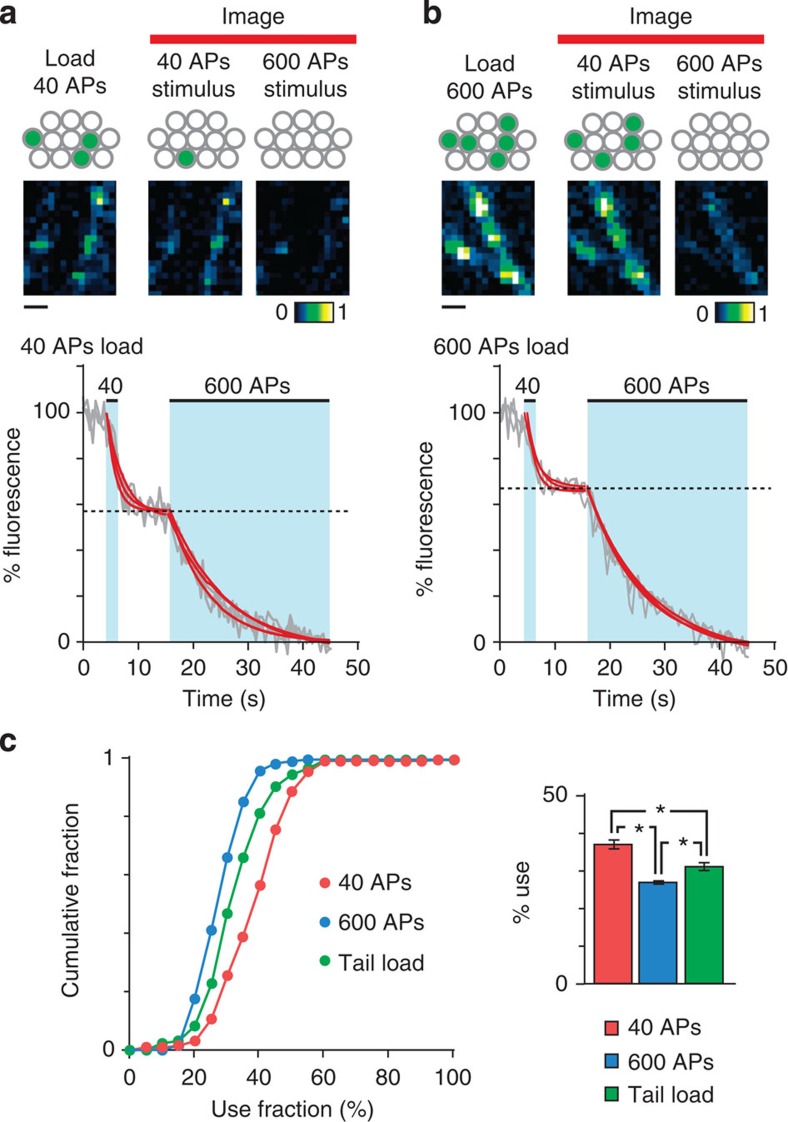
Figure 5. Heterogeneity in functional use of recycled vesicles.
(a) (Top) Schematic illustrating experimental approach. The pool recycled from recruitment of the RRP (40 APs) is labelled and 20 min later subjected to two rounds of stimulation (destaining) in the absence of dye while imaging; 40 APs to release current RRP and 600 APs to release TRP. The ratio between dye loss after 40 APs stimulus versus total dye loss (after 600 APs) provides a measure of subsequent use of the labelled pool. Note: this is not an absolute measure; although 600 APs and 40 APs should together access >90% of the available pool15, residual vesicles or those lost to a non-recycling pool could lead to this value being an overestimate. Accepting these possibilities, normalizing with respect to total release allows comparisons of relative use under different conditions. (Middle) Representative images of 40 APs loading and the two phases of activity-driven dye loss. Scale bar, 2 μm. (Bottom) Plot showing three sample destaining curves (grey lines) each fitted with two single exponentials (red lines). %fluorescence is total fluorescence lost during the two-phase destaining protocol, allowing us to make an estimate of the relative proportion of dye loss arising from the 40 APs versus the larger 600 APs destaining protocol. (b) As in (a) for 600 APs loading. Scale bar, 2 μm. (c) Mean±s.e.m. histogram summary (right) and cumulative frequency distribution plot (left) of % use for 40 APs stimulation after 40 APs loading (n=119 from 4 cultures, red) and 600 APs loading in culture (n=130 from 3 cultures, blue). Green bar (right) and line plot (left) shows a third protocol (tail load) in which only the tail end (<200 APs) of a 600 APs stimulus train had FM-dye present to allow labelling (n=131 from 4 cultures). Mean±s.e.m. use fraction was as follows: 40 APs: 37.2±0.9%, 600 APs: 27.1%±0.6%, tail load: 31.7%±0.9% (one-way ANOVA, P<0.001, Bonferroni's multiple comparison: 40 APs versus 600 APs, P<0.05, 40 APs versus tail load, P<0.05).

