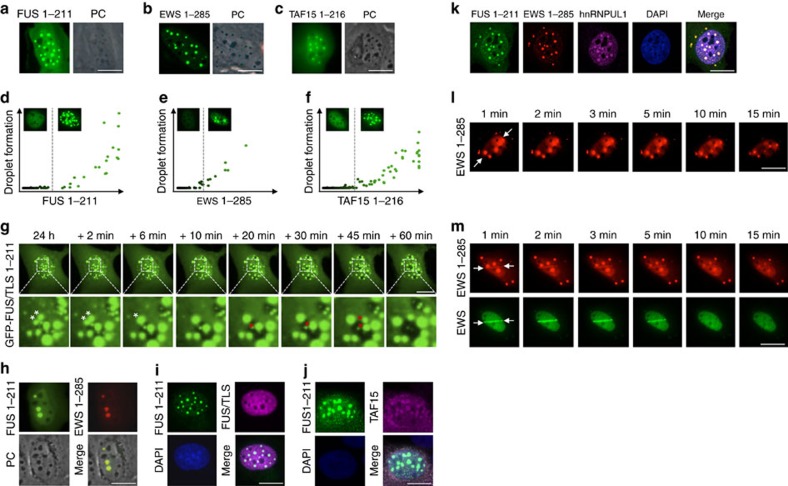
Figure 3. Prion-like domains of LCD-containing proteins phase separate to form homotypic and heterotypic droplets by liquid demixing.
(a) GFP–FUS 1–211 was expressed for 24 h in U-2-OS cells and spontaneous intracellular droplet formation was detected by fluorescence and phase-contrast (PC) microscopy. (b) GFP–EWS 1–285 was expressed and analysed as in a. (c) GFP–TAF15 1–216 was expressed and analysed as in a. (d) Sub-nuclear formation of GFP–FUS 1–211 droplets, as scored and quantified by software-assisted image analysis using the Olympus ScanR system, is depicted as a function of GFP–FUS 1–211 expression to reveal a sharp transition towards droplet formation after reaching intra-nuclear concentrations sufficient to trigger spontaneous liquid demixing. (e) Sub-nuclear formation of GFP–EWS 1–285 was scored and analysed as in d. (f) Sub-nuclear formation of GFP–TAF15 1–216 was scored and analysed as in d. (g) GFP–FUS 1–211 was expressed as in a and monitored live by time-lapse imaging over a period of 1 h in 2-min intervals. Movie stills and magnifications of intracellular liquid droplets are provided. White asterisks mark a fusion event of two droplets, while red asterisks mark a fission event. See also Supplementary Movie 2. (h) GFP–FUS 1–211 and Tomato-EWS 1–285 were co-expressed for 24 h in U-2-OS cells and spontaneous formation of heterotypical droplets was detected by fluorescence and phase-contrast (PC) microscopy. (i) GFP–FUS 1–211 was expressed as in a, cells were fixed and stained for endogenous FUS using an antibody against the carboxyl terminus of the protein. (j) GFP–FUS 1–211 was expressed as in a, cells were fixed and stained for endogenous TAF15. (k) GFP–FUS 1–211 and Tomato-EWS 1–285 were co-expressed as in h, cells were fixed and stained for endogenous hnRNPUL1. (l) Tm-EWS 1–285 was expressed for 24 h, cells were laser microirradiated and imaged as in Fig. 2a–d. Time-lapse movie stills from the first 15 min after irradiation are shown. White arrows indicate the orientation of the laser line. (m) Tm-EWS 1–285 and GFP–EWS were co-expressed for 24 h, cells were laser microirradiated and imaged as in Fig. 2a–d. Time-lapse movie stills from the first 15 min after irradiation are shown. Scale bars, 10 μm.

