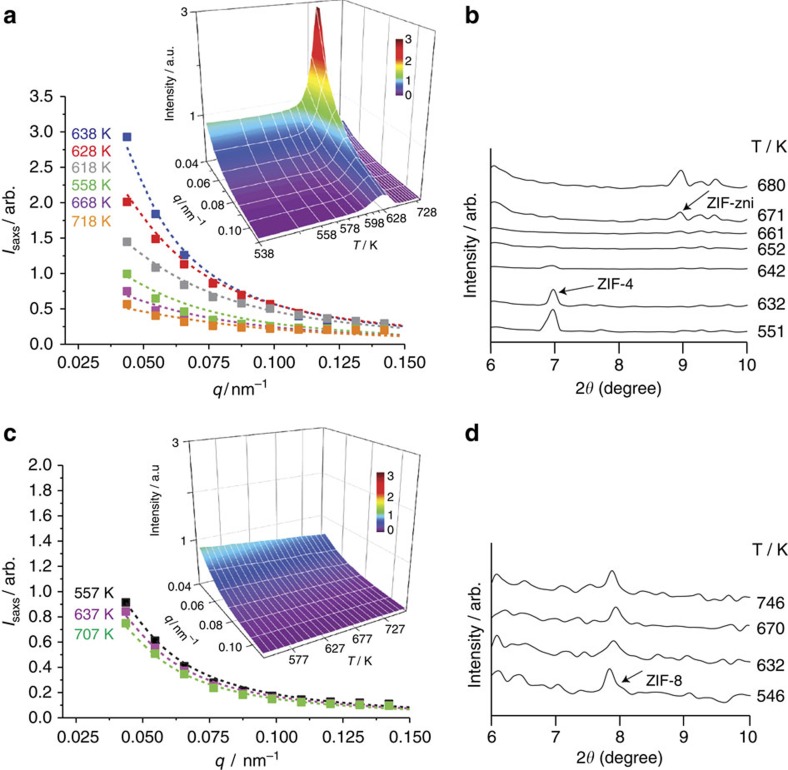
Figure 2. SAXS/WAXS data on ZIF-4 (top) and ZIF-8 (bottom).
(a) I(q)SAXS profiles of ZIF-4, with Lorentzian fits (Supplementary Methods) and three-dimensional plot (inset), highlighting the emergence of a peak between 618 and 663 K (Supplementary Fig. 2f). (b) WAXS data shows the major loss of Bragg diffraction on collapse at ca. 642 K. (c) I(q)SAXS profiles with Lorentzian fits and three-dimensional plot of the SAXS results for ZIF-8. (d) WAXS data show the retention of crystallinity across the entire temperature range studied.

