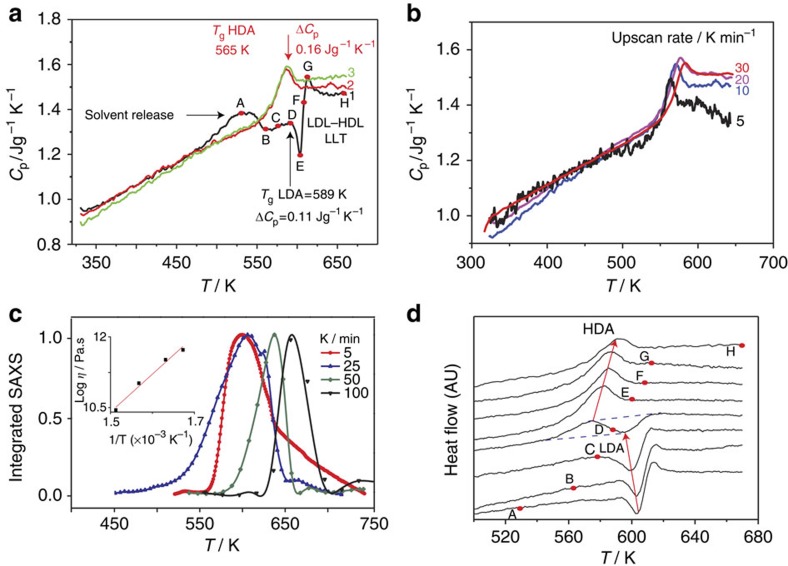
Figure 3. Dynamics of ZIF-4 amorphization, polyamorphic glass transitions and coexistence.
(a) Sequence of DSC up-scans on ZIF-4 at 10 K min−1 starting with ZIF-4 (black), showing: solvent release (A), collapse to LDL phase (D–F), followed by the LLT to HDL (F–H). The jump in the isobaric heat capacity (Cp) through the LLT (E–G) is 0.33 J g−1 K−1. ΔCp is the difference in Cp from glass to liquid at Tg, being 0.11 and 0.16 J g−1 K−1 for LDA and HDA phases, respectively. The endotherms in successive scans (2–red, 3–green) relate to HDA phase. (b) DSC second up-scans on the same samples at different rates right after cooling, yielding Tg and m for HDA. (c) The change in integrated SAXS  , showing the increase of the peak temperature (Tpeak) for different heating rates, giving Tg and m for the LDA phase. Inset: dependences of the Maxwell viscosity12
η=G∞.τ, where G∞ and τ are the adiabatic shear modulus (2 GPa)40 and structural relaxation time ∼1/heating rate, respectively. (d) DSC up-scans preheated to temperatures A(529 K), B (563 K), C(578 K), D(588 K), E(601 K), F(608 K), G(613 K), H(673 K), cooled back to room temperature, and then reheated to 673 K—all at 10 K min−1. Arrows indicate Tg HDA increasing and Tg LDA decreasing with increases in initial scan temperature. Temperature at 588 K reveals coexistence of LDA and HDA. With double scans (d), amorphization stages occur 20 K lower than for single scans (a).

