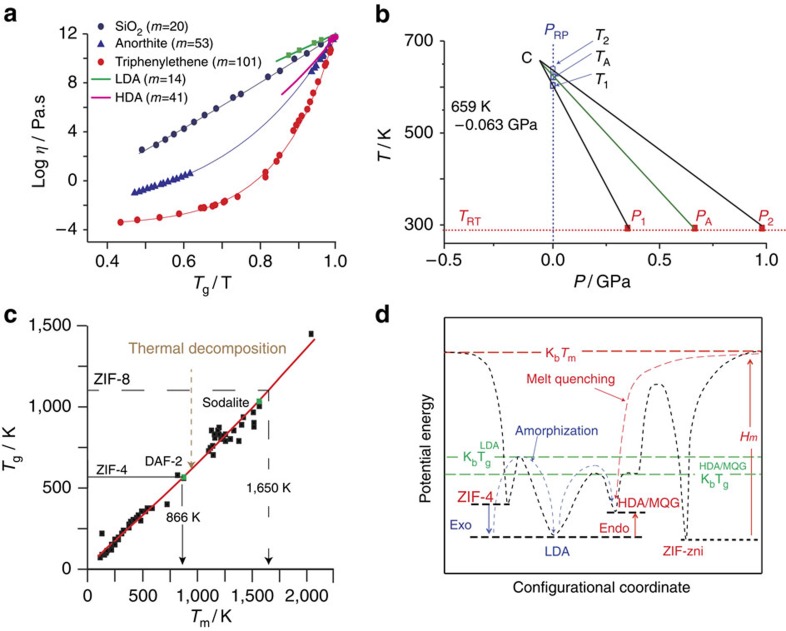
Figure 4. Fragilities and critical point of ZIF-4 polyamorphs, projecting Tm from Tg, and PEL schematic of ZIF-4 amorphization, melting and quenching routes.
(a) Angell plot showing the fragility of LDL and HDL ZIF-4 (Fig. 3b,c), alongside other glass-forming liquids41 including the silica with <20 p.p.m. hydroxyl and <60 metallic impurities. Solid lines are fits to the measured viscosity-temperature relation of the model derived in previous literature16,42. (b) T–P phase diagrams obtained from the limiting thermobaric amorphization parameters for ZIF-4 P1, P2, T1 and T2, which extrapolate to a critical point C at negative pressure Tc (659 K) and Pc (–0.063 GPa). PA and TA refer to 50% amorphization points under pressure (RP)5 and temperature (RT)18, respectively. (c) 2/3's Law (Tg versus Tm) for different glass-forming systems29,30,31, including ZIF-4 and ZIF-8 compared with DAF-2 and sodalite, respectively. The thermal degradation temperature separating the locations of the two amorphized ZIFs is shown. (d) Schematic of the PEL43 for ZIF-4, informed from DSC experiments from Figs 1b and 3a. The adjacent LDA and HDA minima bear resemblance to the two states for water, different in density and topology, recently identified in modelling ST2 water36.

