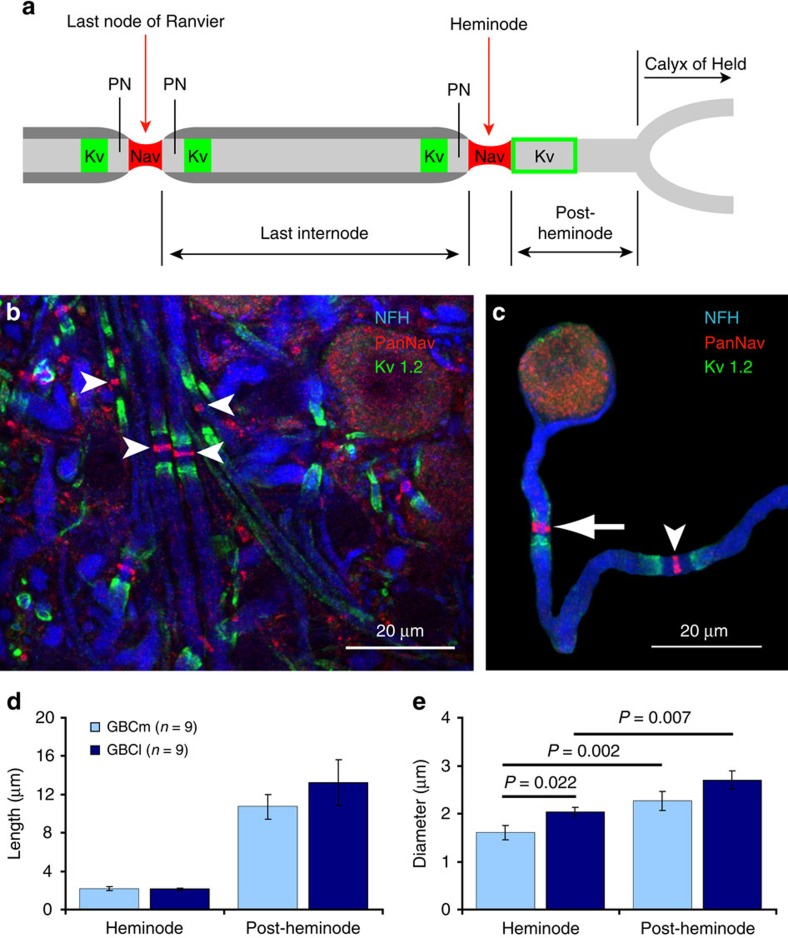
Figure 4. Morphometry of the pre-terminal segment of GBC axons.
(a) Schematic of the terminal part of a GBC axon (grey) illustrating the measured parameters. Red segments indicate the position of sodium channels at the last node of Ranvier and the heminode. PN denotes paranode. Green rectangles indicate the position of juxtaparanodal Kv1.2 channels and the green open box indicates the position of pre-calyceal Kv1.2 channels. (b) Maximum-intensity projection of confocal images displaying axons (blue, neurofilament heavy chain) in the MNTB. Arrowheads indicate nodes of Ranvier stained with an anti-pan-Nav antibody (red). Kv1.2 channels are shown in green. (c) Distal part of a GBC axon (blue) after digital extraction from the surrounding image. The last node of Ranvier (arrowhead) and the heminode (arrow) are labelled with an anti-pan-Nav antibody (red). Juxtaparanodal and pre-calyceal Kv1.2 channels are shown in green. (d) Heminode length and post-heminode length do not differ between GBCmed and GBClat axons. (e) The heminode diameter is larger in GBClat than in GBCmed axons (P=0.022, Mann–Whitney test). In GBCmed and GBClat axons the post-heminode diameter is larger than that of the heminode (P=0.002 for GBCmed, paired t-test; P=0.007 for GBClat, paired t-test). Data in d,e are represented as mean±s.e.m. Scale bars, 20 μm (b,c).

