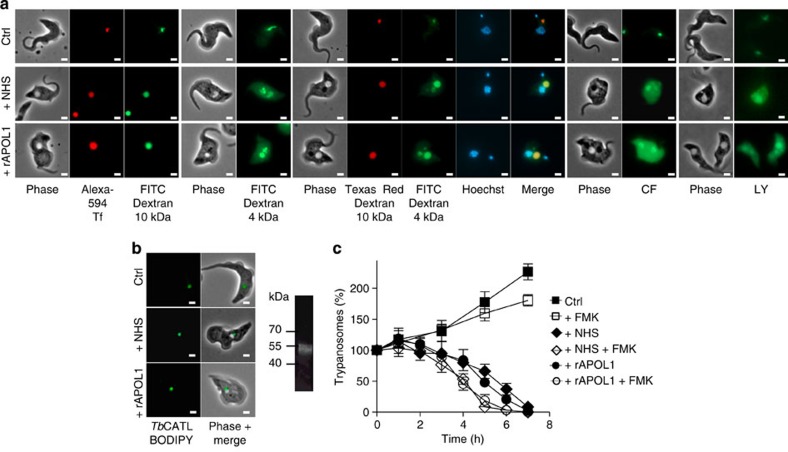
Figure 2. LMP and trypanolysis in control and 30% NHS- or 10 μg ml−1 rAPOL1-treated T. brucei.
(a) Intracellular localization of fluorescent markers. Tf, transferrin; CF, carboxyfluorescein; LY, Lucifer yellow (1 h incubation; scale bar, 2 μm; same exposure time in all panels). (b) Intracellular localization of TbCATL–BODIPY (1 h incubation; scale bar, 2 μm). Right panel: TbCATL–BODIPY fluorescence in a trypanosome extract submitted to SDS–polyacrylamide gel electrophoresis. (c) Trypanolysis following 30-min preincubation with 10 mM cathepsin inhibitor FMK-024 (error bars: s.e.m.; three replicates; n=3).

