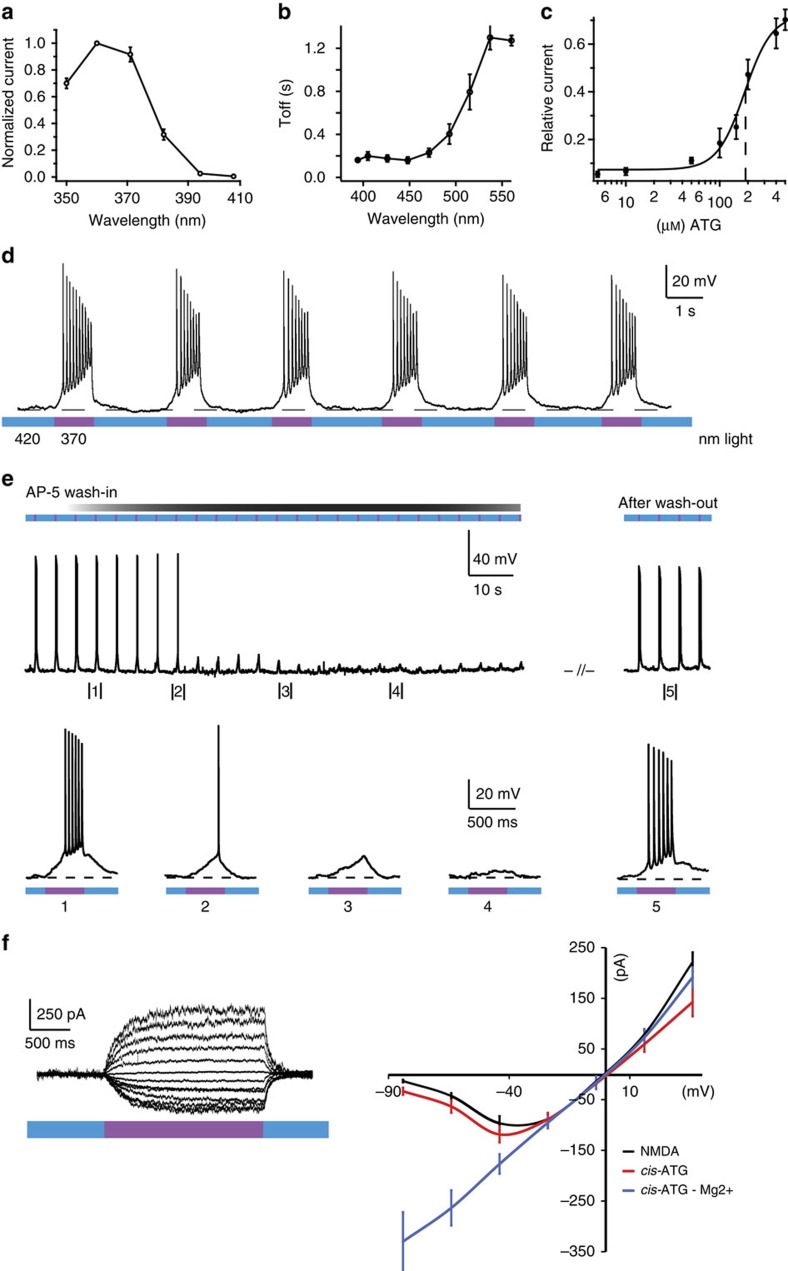
Figure 2. Photopharmacology of ATG.
(a) Action spectrum of ATG recorded in layer 2/3 cortical neurons in an acute slice preparation in presence of 200 μM ATG in ACSF. Current amplitude was measured after 5 s light stimulation with the respective wavelength and normalized to the maximal current amplitude at 360 nm. (b) Wavelength screening for τoff kinetics of ATG-mediated currents between 400 and 560 nm light. Best τoff kinetics were achieved at 400–450 nm light. (c) Dose–response relationship of ATG-mediated currents in cortical slice preparations. Concentrations from 1 to 500 μM were tested. The EC50 is 185 μM (black dashed line) and was calculated using the Hill-equation. (d) Current-clamp recording of a layer 2/3 cortical neuron. Irradiation with 370 nm light (purple) induces robust action potential firing that is terminated by irradiation with 420 nm light (blue). (e) Washing in D-AP-5 (40 μM), an NMDA-specific antagonist, blocks the ATG-mediated light-dependent action potential firing. (f) Current–voltage relationships indicative of NMDARs as targets for ATG. Black; current–voltage relationship of puff-applied NMDA (200 μM) currents (n=12 cells). Red; current–voltage relationship of ATG-mediated currents under 370 nm light (n=10 cells). Blue; current–voltage relationship of ATG-mediated currents in the absence of Mg2+ ions (n=10 cells). Error bars indicate s.e.m.

