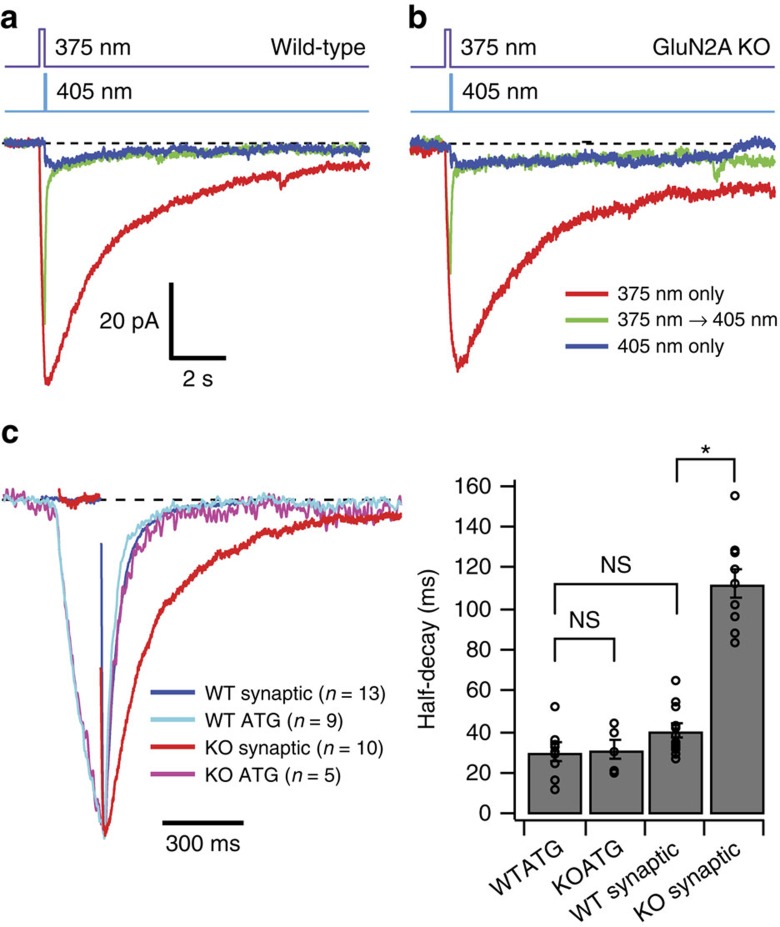
Figure 4. Comparison of ATG photoswitching responses between wild-type and GluN2A KO animals.
(a) Population averages of light-evoked currents from WT CA1 pyramidal cells in response to 375 nm (100 ms) only, 375 nm followed by 405 nm (50 ms), and 405 nm only when locally applying ATG (100 μM) with a patch pipette (n=9 cells). (b) Population averages of photoswitching currents from GluN2A KO animals under same conditions as (a) (n=5 cells). (c) (left) Normalized currents in response to 375–405 nm photoswitching from (a) and (b) and population averages of NMDAR EPSCs in wild-type (n=13 cells) and KO animals (n=10 cells). Traces were aligned on their peaks and electrical artifacts from presynaptic stimulation have been blanked. Right: Bar graph of half-decays. Error bars indicate s.e.m. *P<0.05 and NS indicates comparisons that are not significantly different (Steel Dwass all pairs nonparametric multiple comparison test).

