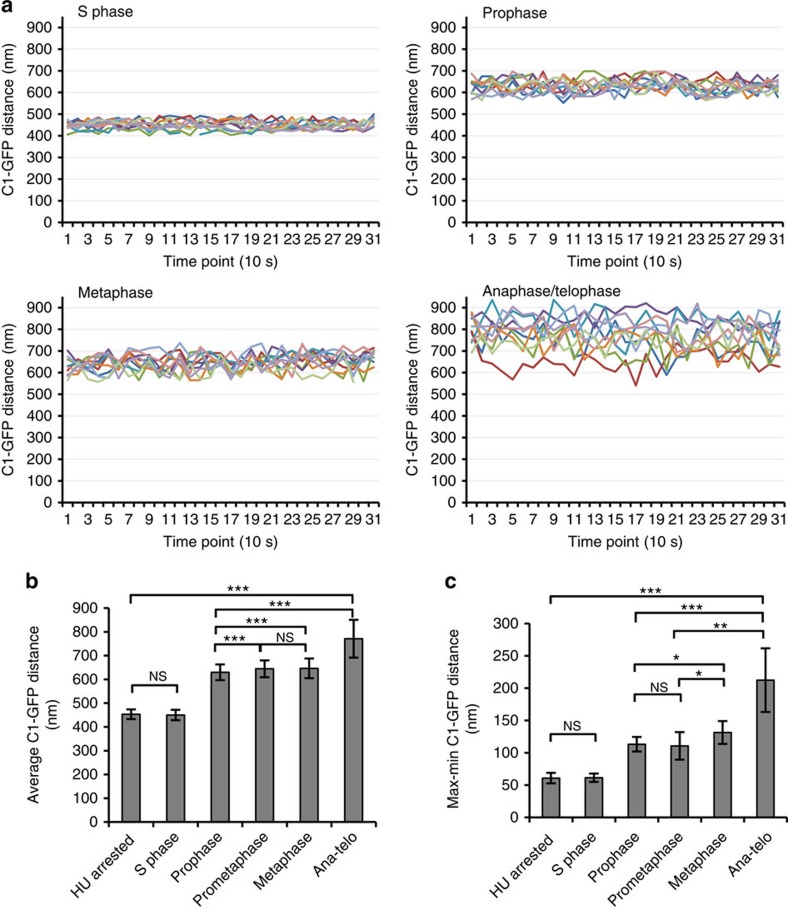
Figure 2. The configuration of a centriole pair can be determined by light microscopy.
(a) Analysis of centriole movement within C1–GFP-expressing cells. Mother and daughter centriole pairs were imaged during 5 min with 10 s resolution. Distances between mother and daughter-associated C1–GFP signals were calculated and plotted. In cycling S-phase cells, the average distance between C1–GFP signals during the imaging period is 450 nm, with small oscillations. In prophase and metaphase cells, the C1–GFP distance is ∼650 nm, and oscillations between the centrioles increased twofold with respect to the S phase. Centrioles in anaphase and telophase move at distances that are larger than 700 nm and with large oscillations between the time points, indicating that the two centrioles lost association. Each line on the graph represents one mother–daughter centriole pair. (b) Histogram represents the average mother-to-daughter centriole C1–GFP distance from all measured centriole pairs for the indicated phase of the cell cycle, error bars are the s.d. (n=10 centriole pairs, 31 time points per pair). (c) Histogram represents average differences between maximal and minimal C1–GFP values from the data set presented in b (average from 10 time-lapse recordings, 31 time points per recording), error bars are the s.d. The statistical significance between the data sets was determined by a two-tailed t-test using Microsoft excel. NS, not statistically different, *P≤0.05, **P≤0.01, ***P≤0.001.

