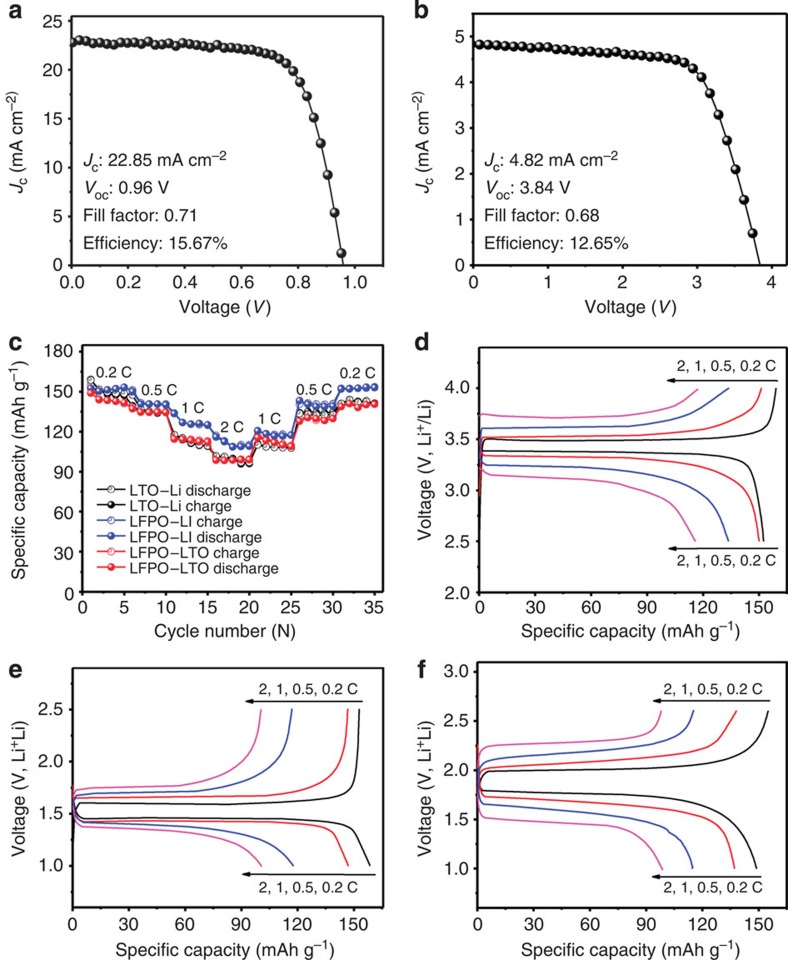
Figure 2. Performance of PSCs and LIBs.
(a) J–V curve for single PSC. (b) A typical J–V curve for the connected PSCs unit with four single PSCs connected in series. (c) Rate capabilities of LFPO–Li, LTO–Li and LFPO–LTO cells measured at various C-rates (1 C=170 mA g−1) in the voltage ranges of 2.5–4.0, 1.0–3.0 and 1.0–2.6 V, respectively. (d–f) Typical charge–discharge curves of (d) LFPO–Li, (e) LTO–Li and (f) LFPO–LTO cells.

