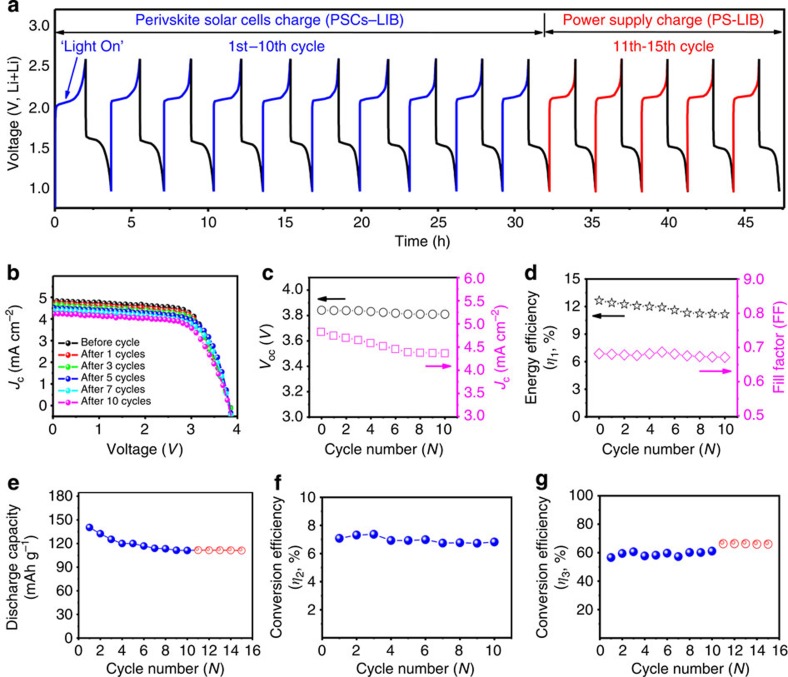
Figure 3. Performance of fabricated PSCs–LIB and PS-LIB.
(a) Voltage–time (V–t) curves of the PSCs–LIB device (blue and black lines at the 1st–10th cycles: charged at 0.5 C using PSC and galvanostatically discharged at 0.5 C using power supply. Red and black lines at the 11th–15th cycles: both galvanostatically charged and discharged at 0.5 C using power supply). (b) J–V curves, (c) Voc and Jc, (d) fill factor (FF) and solar-to-electric PCE (η1) of the connected PSCs before and after various cycles. (e) Discharge capacity (Note, a slight variation was observed for the discharge duration at different cycle numbers), (f) overall photo-electric conversion efficiency of the PSCs–LIB device (η2) and (g) energy storage (conversion) efficiency (η3) of LIB, as a function of the cycle number.

