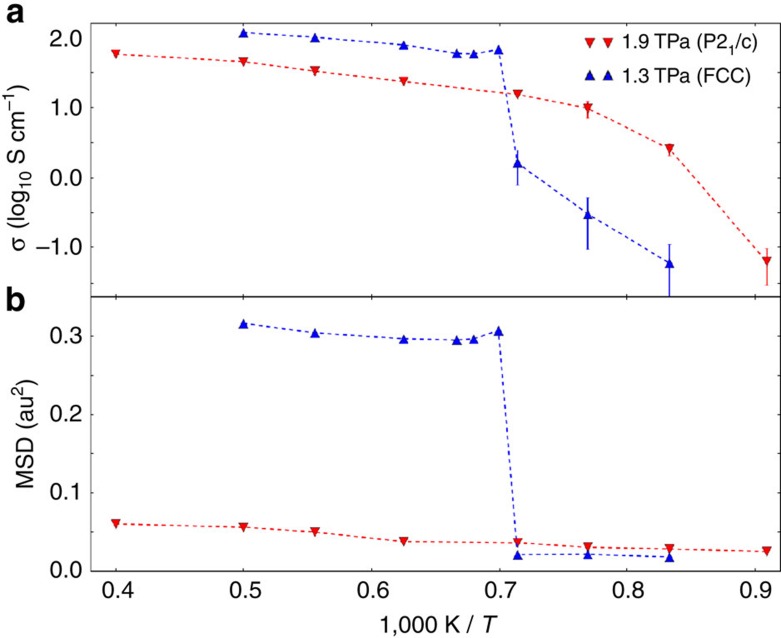
Figure 5. Ionic conductivity and MSD of oxygen.
(a) Ionic conductivity across the solid to SI phase transition. (b) The MSD of oxygen. The error bars indicate the standard error estimated with three non-overlapping intervals. Error bars smaller than the symbols are not shown in the graph. Notice the sharp change in the MSD in correspondence to the transition from P3121 to FCC-SI. By contrast, the transition from P21 (0 K) to P21/c-SI does not show any signature in the MSD.

