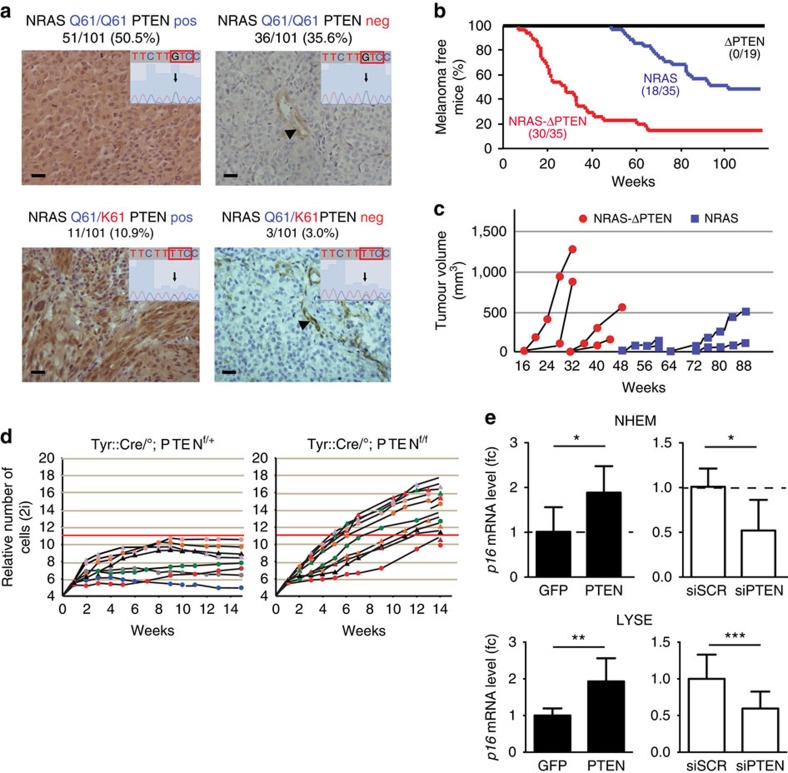
Figure 4. NRASQ61K and PTEN loss cooperate during melanoma initiation.
(a) Human melanoma library containing 101 samples was subjected to immunohistochemical analysis for PTEN expression alongside NRAS mutational status. For each case type: the minimized window in the foreground represents the DNA sequence of NRAS at codon 61, while the background picture is the corresponding PTEN immunostaining. Arrowheads indicate blood vessels, internal positive control for PTEN expression. Vertical arrows indicate the location of the G to T mutation. Scale bar, 100 μm. (b) Kaplan–Meier (KM) melanoma-free mice analysis of ΔPTEN (n=19), NRAS (n=35) and NRAS-ΔPTEN mice (n=35). The KM curves between NRAS and NRAS-ΔPTEN are significantly different (P<10−5) using the Mantel–Cox test. NRAS=Tyr::NRASQ61K/°, ΔPTEN=Tyr::Cre/°; PTENf/+ and NRAS-ΔPTEN=Tyr::NRASQ61K/°; Tyr::Cre/°; PTENf/+. The mean number of melanomas per mouse was 1.6 and 2.1 for NRAS and NRAS-ΔPTEN mice, respectively, with a P-value of 0.37 (Student's t-test). (c) Tumour growths were measured and tabulated. The rate of growth of four representative tumours from NRAS and NRAS-ΔPTEN were plotted in relation to size during an 88-week interval. NRAS-ΔPTEN tumours averaged a steeper and earlier growth rate in comparison with NRAS controls. (d) Melanocytes were established from the skins of Tyr::Cre/°; PTENf/+ and Tyr::Cre/°; PTENf/f pups. Cells were directly counted every week and the growth curve was plotted as relative number of cells in log2 form (see Delmas et al.32). Each curve corresponds to the culture established from the back skin of a single pup. Cells with biallelic disruption of the PTEN gene, PTENf/f, bypassed efficiently senescence when comparing the heterozygous, PTENf/+. (e) p16 mRNA as measured by quantitative reverse transcriptase–PCR (fold change) transfection in normal human epithelial melanocyte (NHEM) (top panel) and Lyse human melanoma cell line (bottom panel) with GFP and PTEN expression vectors and with scramble (siScr) and PTEN (siPTEN) siRNA. Error bars represents.d. *P-value <0.05, **P-value <0.01 and ***P-value <0.001. Statistical significance was determined by Mann–Whitney test. Experiments were performed in biological triplicates.

