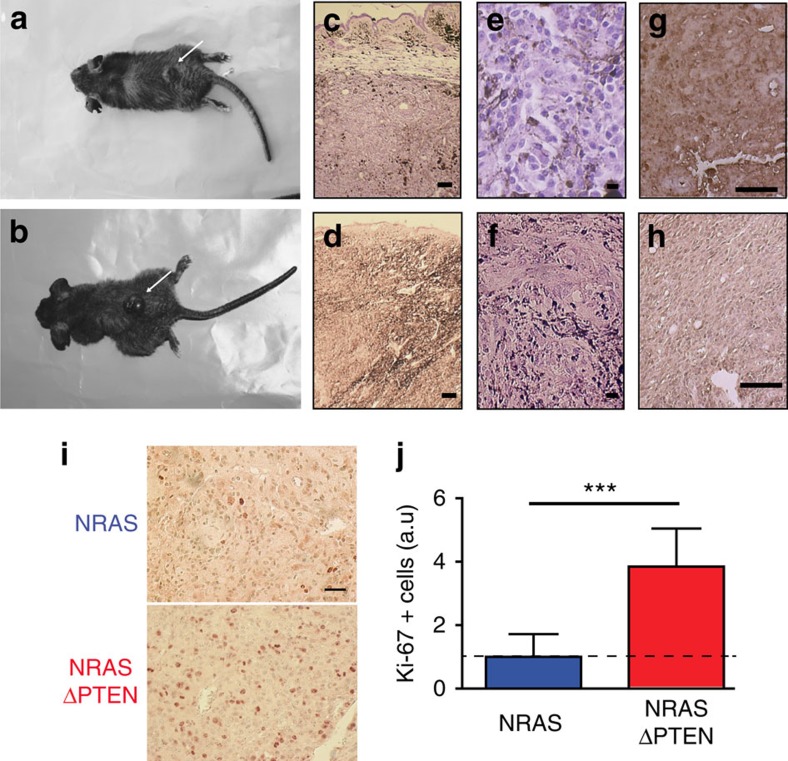
Figure 5. NRAS ΔPTEN melanoma characteristics.
(a,b) Dorsal melanoma appearing in NRAS (a) and NRAS-ΔPTEN (b) mice (arrow). Melanoma arose from different part of the body including hairy part, pinnae and tails/paws (see Supplementary Table 1). (c–f) Haematoxylin and eosin staining of an NRAS (c,e) and NRAS-ΔPTEN (d,f) cutaneous melanoma. (e,f) Higher magnification reveals irregularly shaped pigmented cells with diverse sizes and large nuclei. (g,h) Positive immunostaining for melanoma marker S100 in NRAS and NRAS-ΔPTEN tumours. (i) Positive Ki-67 staining of NRAS and NRAS-ΔPTEN tumour sections. (j) Graphical representation of the relative number of Ki-67-positive cells in NRAS and NRAS-ΔPTEN tumour sections. The relative number of Ki-67-positive cells correspond to the ratio of the number of Ki-67+ cells from identical surface in NRAS or NRAS-ΔPTEN tumour sections versus the number of Ki-67+ cells from identical surface in NRAS tumour sections. Statistical significance was determined by Mann–Whitney test. ***P-value <0.001. Five hundred cells were assessed from four fields and four independent experiments for each genotype. Scale bars, 100 μm (c,d), 10 μm (e,f), 50 μm (g,h) and 10 μm (i).

