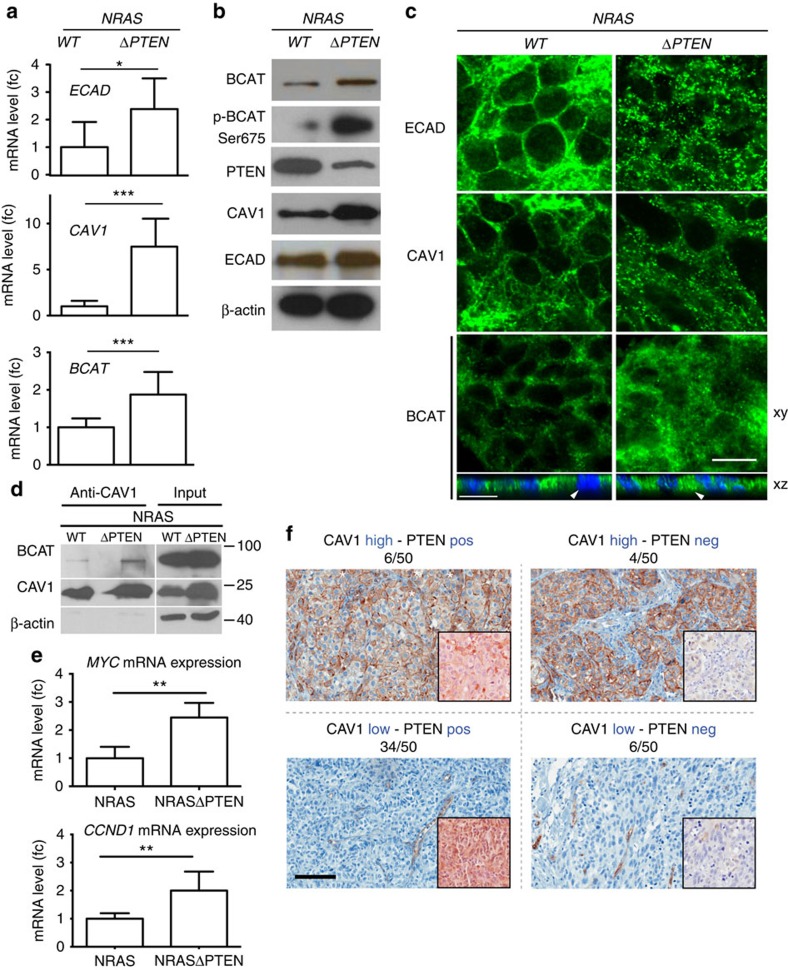
Figure 7. PTEN loss induces ECAD internalization and metastasis.
(a) mRNA levels of ECAD (top), CAV1 (middle) and BCAT (bottom) in NRAS and NRAS-ΔPTEN mouse melanoma as measured by quantitative reverse transcriptase–PCR (fc, fold change). Experiments were performed three times. Error bars represent s.d. *P-value <0.05, **P-value <0.001. Statistical significance was determined by Mann–Whitney test. (b) Western blot analysis of uncultured whole tumour lysates from NRAS and NRAS-ΔPTEN using antibodies against BCAT (total and pSer675), PTEN, CAV1, ECAD and β-actin. Western blot analyses were performed at least two times depending on antibody. (c) Immunofluorescence of serial NRAS and NRAS-ΔPTEN tumour sections, stained for ECAD, CAV1 and BCAT. Scale bar, 10 μm. xz projection from confocal image stacks of β-catenin-stained NRAS and NRAS-ΔPTEN tumours counterstained with 4,6-diamidino-2-phenylindole (DAPI). Arrowheads indicate nucleus. Scale bar, 16 μm. Immunofluorescence experiments for the NRAS and NRAS-ΔPTEN tumour cryosections were performed two times with similar results. (d) Interaction of CAV1 with β-catenin (BCAT) in NRAS and NRAS-ΔPTEN tumour samples. Cell lysates containing 400 μg of total proteins were subjected to IP with an anti-CAV1 antibody. The co-IP of β-catenin with CAV1 was detected by western blotting (WB) using anti-β-catenin and anti-CAV1 antibodies. Total protein input is shown. This experiment was performed twice. (e) mRNA levels of downstream β-catenin target genes c-MYC and CCND1 as measured from NRAS and NRAS-ΔPTEN mouse melanoma by quantitative reverse transcriptase–PCR (fc, fold change). Error bars represent s.d. **P-value <0.01. Statistical significance was determined by Mann–Whitney test. (f) CAV1 and PTEN were detected by immunohistochemistry on a series of 50 human melanoma sections from the second cohort. Sections of patients were either AEC stained (red) for CAV1 (background image) or PTEN (foreground image, lower-right corner) and counterstained with haematoxylin (blue). Staining for CAV1 was scored as high or low, while the amount of PTEN as positive (pos) or negative (neg). Among 50 melanoma biopsies, 34 presented a low amount of CAV1 and a positive staining for PTEN (34/50). Scale bar, 100 μm.

