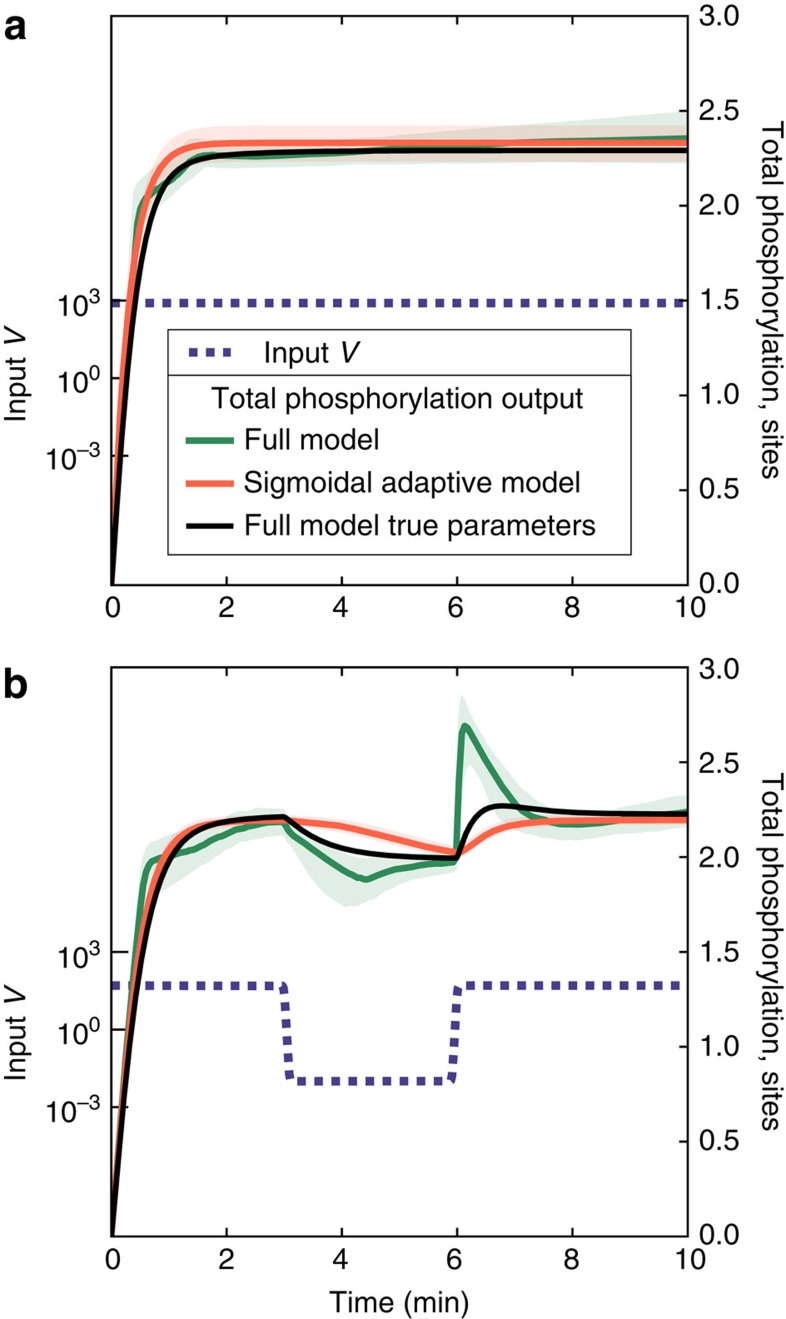
Figure 3. Time series responses to out-of-sample inputs in inferred models of multisite phosphorylation.
Plotted is the predicted response (right axis) to (a) constant and (b) time-varying input (left axis, blue lines). Fit to N=300 constant input data points, the full-known model (green) produces erratic behaviour typical of overfitting (especially evident in b), while the adaptive sigmoidal model (orange) produces more stable out-of-sample predictions with median behaviour that is closer to the true dynamics. Plotted is the median behaviour over 100 samples from each model's parameter posterior (Supplementary Note 3), with shaded regions indicating 90% confidence intervals, which are in some cases smaller than the width of the line.

