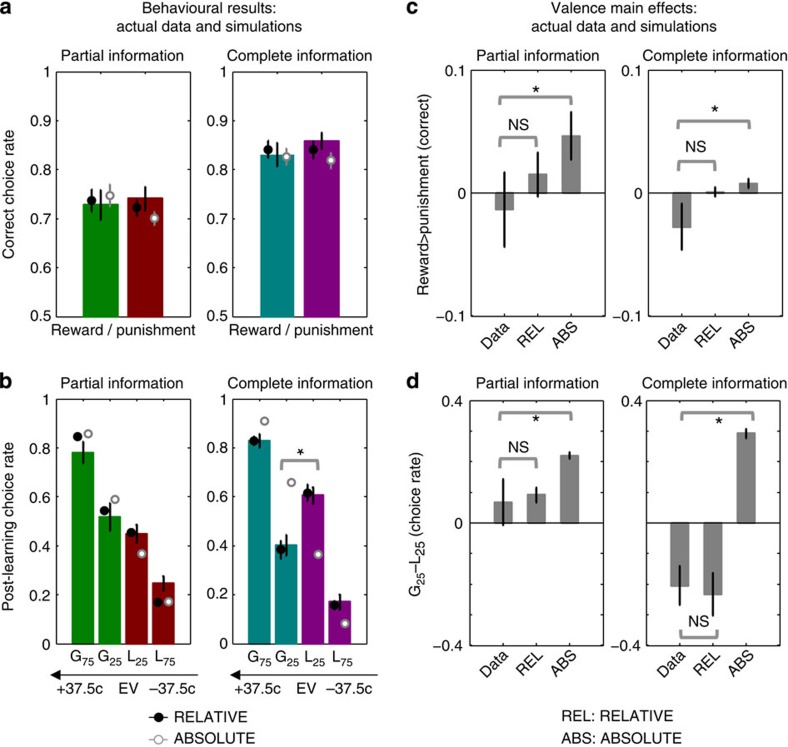
Figure 2. Behavioural results and model simulations.
(a) Correct choice rate during the learning test. (b) Choice rate in the post-learning test. G75 and G25: options associated with 75% and 25% per cent of winning 0.5€, respectively; L75 and L25: options associated with 75% and 25% per cent of losing 0.5€, respectively. EV: absolute expected value (Probability(outcome) × Magnitude(outcome)) in a single trial. The values +37.5¢ and −37.5¢ correspond G75 and the L75 options, respectively. In a and b coloured bars represent the actual data and black (RELATIVE) and white (ABSOLUTE) dots represent the model simulated data. (c) Reward minus punishment correct choice rate during the learning test. (d) G25 minus L25 choice rate during the post learning test. *P<0.05 one sample t-test; NS, not significant (N=28). Error bars represent s.e.m.

