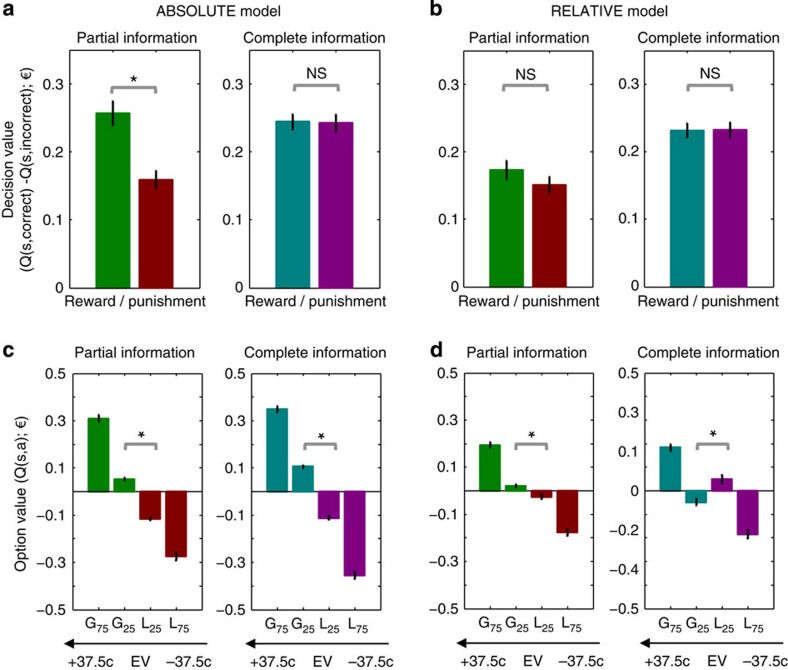
Figure 4. ABSOLUTE and RELATIVE model final value estimates.
(a,b) The bars represent, for each model, the final optimal decision value estimates (the value of the correct minus the value of the incorrect option). (c,d): the bars represent, for each model, the final option value estimates.. G75 and G25: options associated with 75% and 25% per cent of winning 0.5€, respectively; L75 and L25: options associated with 75 and 25% per cent of losing 0.5€, respectively. EV: absolute expected value (Probability(outcome) * Magnitude(outcome)) in a single trial. The values +37.5¢ and −37.5¢ correspond G75 and the L75 options, respectively. The estimates are generated from individual history of choices and outcomes and subject-specific free parameters. *P<0.05 one sample t-test; ns: not significant (N=28). Error bars represent s.e.m.

