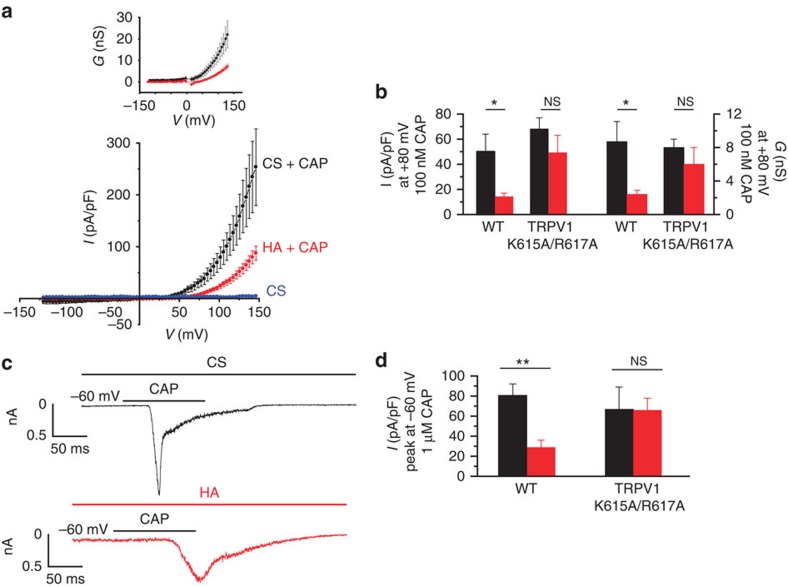
Figure 2. Inhibition by HA of CAP-evoked currents in HEK-TRPV1 cells.
(a) Average I–V relationships before (blue symbols, CS) and after the application of 100 nM CAP (black symbols, CS+ CAP; n=19) and after the application of HA + 100 nM CAP (red symbols; n=18) in HEK-TRPV1-EGFP(+) cells preincubated with HA for 30–60 min. Inset, G–V curves obtained from the I–V relationships. The values of different parameters were measured from the I–V ramps fit with the Boltzmann function I=gx (V−ER)/(1+exp ((V1/2−V)/S)). In control, Gmax=45±7 nS, V1/2=151±12 mV, zg=0.6, (n=19), in the presence of HA: Gmax 22±2 nS, V1/2 147±10 mV, zg=0. 7 (n=18). (b) The average current (left axis) and average conductance (right axis) at +80 mV obtained from the I–V relationship shown in a in the WT and TRPV1 K615A/R617A mutated channel. (c) Whole-cell currents at −60 mV in response to 1 μM CAP in CS (black trace) and cells preincubated with HA for 30–60 min (red trace). (d) The average values of peak currents evoked by 1 μM CAP at −60 mV in the WT and TRPV1 K615A/R617A mutated channel, in CS (black, n=8) and in the presence of HA (red, n=6). The data are represented as the mean±s.e.m., Student's t-test: **P<0.01; *P<0.05; NSP>0.5.

