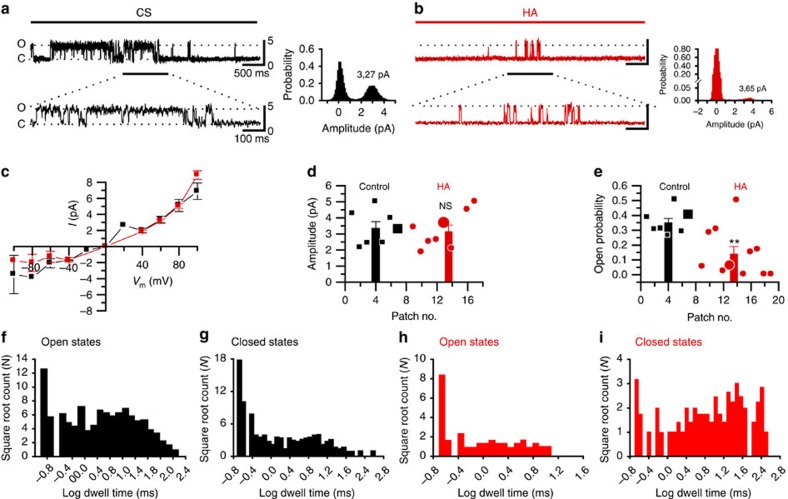
Figure 3. Modulation of TRPV1 single-channel activity by HA.
Recording in cell-attached patches of HEK-TRPV1-EFYP (+) cells of the single-channel activity evoked by 0.25 μM CAP in the recording pipette. (a) A sample recording of TRPV1 single-channel activity under perfusion with CS. (b) A sample recording of single-channel activity from a cell preincubated 30–60 min in HA and recorded under perfusion with HA solution. Insets, single-channel amplitude probability histogram of each recording: black, control; red, in a patch treated with HA. The same scale bar values for a apply to b. (c) I–V curves obtained in CS (black symbols, n=7) and after exposure to HA (red symbols, n=8). (d) Single-channel amplitudes obtained from individual patches. The bars correspond to the mean values of single-channel amplitudes±s.e.m in each condition. (e) The open probability of different patches in CS (n=7) in HA (n=8). In d and e larger symbols represent the data from the measures performed in the traces shown in a and b. The bars represent the mean values of single-channel open probability±s.e.m. (f–i) The open and closed states dwell time distributions from the traces shown in a and b. Black, control; red, after treatment with HA. Long closing states that were infrequent in CS but increased their frequency in HA. All data were obtained at +60 mV. The data are represented as the mean±s.e.m., Student's t-test: **P<0.01; NSP>0.5.

