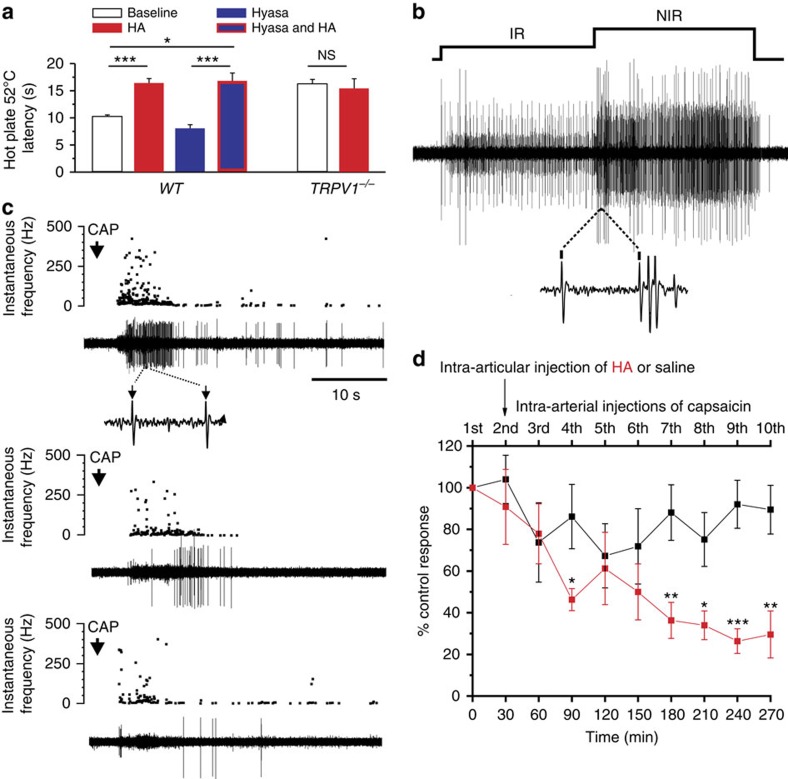
Figure 5. Effect of HA on behavioural nocifensive responses to noxious heat in mice and on nerve impulse activity of sensory nerve fibres innervating the rat knee joint.
(a) The latency of the first nocifensive response (licking, biting, lifting, guarding, shaking or jumping) obtained in wild-type or TRPV1−/− null mice in control conditions (baseline) or after receiving a 10 μl injection of HA or Hyasa in the left paw or after receiving an injection of Hyasa followed by another injection of HA in WT (n=25,12,11,7) and TRPV1−/− (n=25,18). (b) Recording of the multiunit nerve impulse activity in a filament of the saphenous nerve, evoked by an inward rotation of the knee joint in the non-noxious (IR) and the noxious range (NIR) (10 s each). The dotted lines indicate an expanded recording during the marked time interval in which units of different amplitudes have been selected with an amplitude filter. (c) Nerve impulse activity evoked by the intra-arterial injection of 100 μl of 10 μM CAP (arrows) performed at 30 min intervals, in the same multiunit filament shown in b. In each panel, the instantaneous frequency is represented in the top and original nerve impulse recording, below. Separate units were identified by their amplitude and shape, CAP-evoked discharge started a few seconds after the onset of injection and lasted, on average, 22±2 s (n=7). The upper panel corresponds to the control CAP injection and includes an expanded view of the impulse firing during the time indicated between the dotted lines. Notice that this unit evoked by CAP has a similar spike morphology as one of the units recruited by joint rotation in b. Middle and lower panels depict the nerve impulse discharge evoked by intra-arterial injection of 10 μM CAP 1 and 2.5 h, respectively, after intra-articular injection of 100 μl of 1% HA. (d) The average values of the total number of CAP-evoked impulses over the period of time shown expressed as a percentage of the mean number of impulses evoked by the first (control) intra-arterial injection of CAP (100%). The arrow indicates the time at which either saline (black symbols, n=7) or HA (red symbols, n=8) were injected intra-articularly into knee joints. The data are represented as the mean±s.e.m., Student's t-test: ***P<0.001; **P<0.01; *P<0.05; NSP>0.5.

