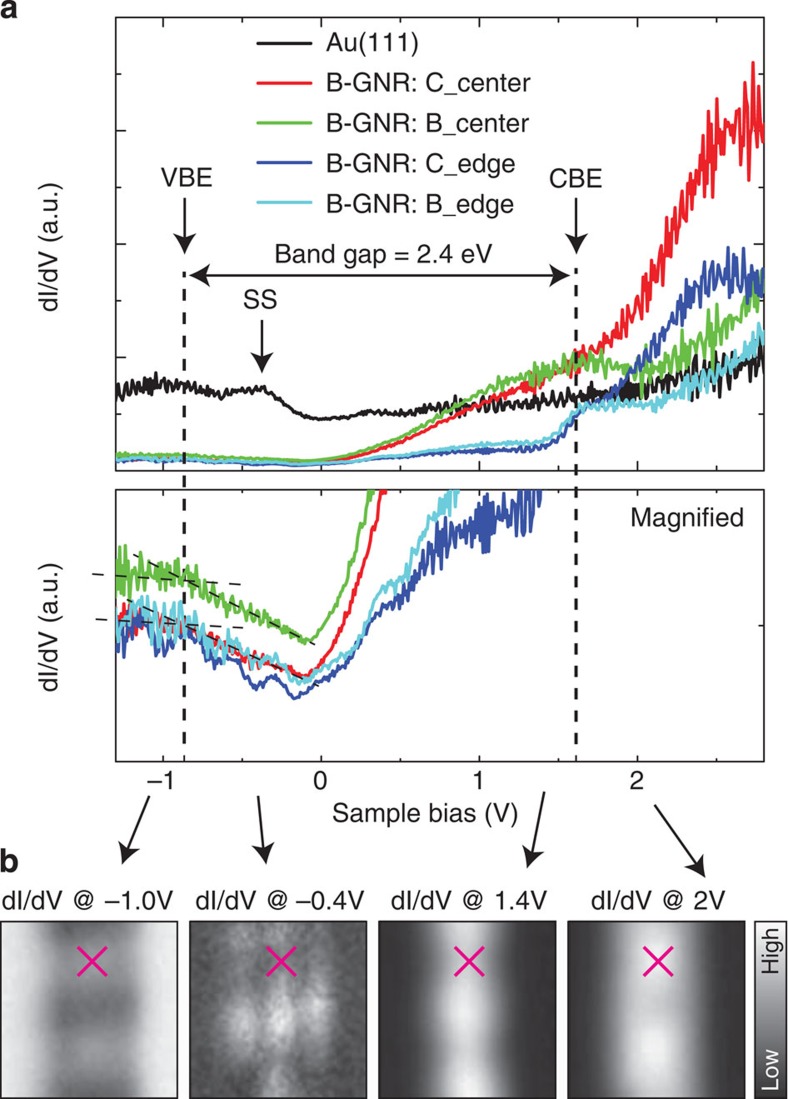
Figure 2. dI/dV curve on B-GNR.
(a) Differential conductance (dI/dV) spectra taken at four different sites of N=7 B-GNR and one Au(111) site with a clean Au tip. The spectra were numerically calculated from the measured bias dependent curves of the tunnelling current. The bias voltage is only here redefined with respect to the tip grounding instead of the sample grounding. (b) Constant height dI/dV maps measured with a lock-in amplifier (root mean square amplitude=14 mV and frequency=521 Hz) at the different bias voltages. Pink crosses indicate at the centre of the same C4B2 site.

