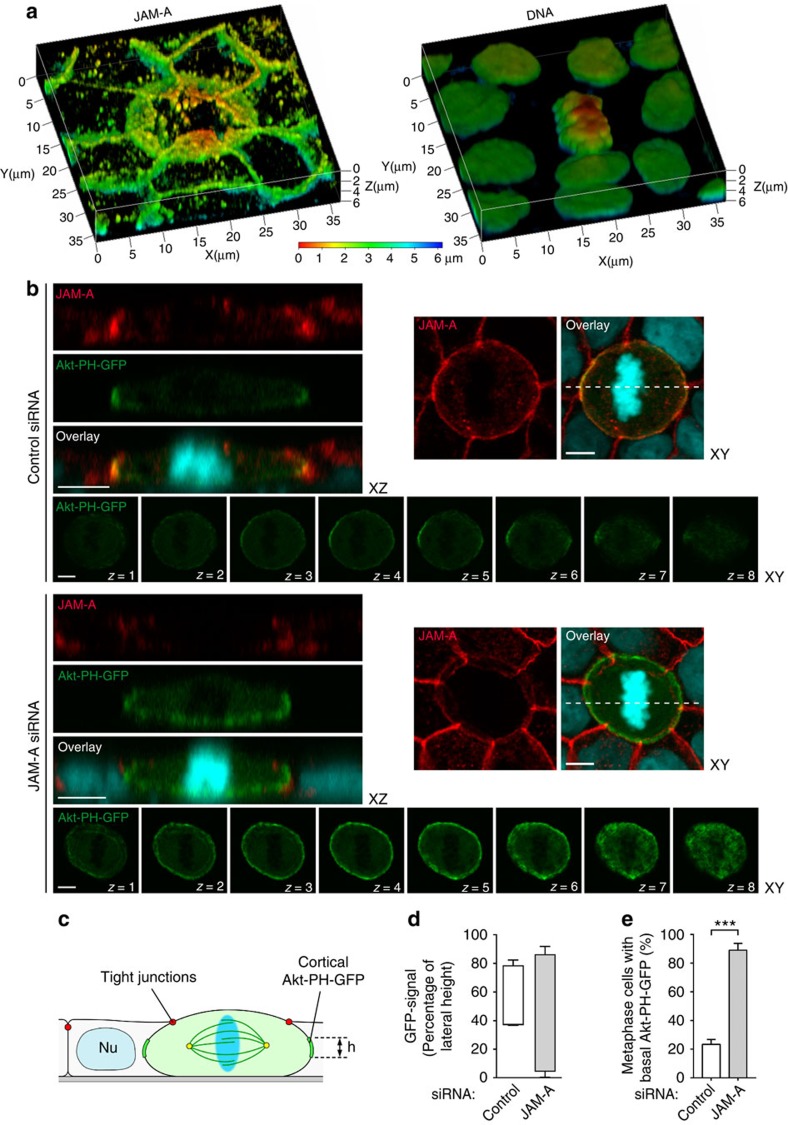
Figure 7. JAM-A controls cortical PtdIns(3,4,5)P3 localization during mitosis.
(a) MDCK cells round up during mitosis. 3D view of a mitotic MDCK cell stained for JAM-A (left) and DNA (right). The heat map represents depth coding and indicates relative positions from the apex (red) to the basal side (blue) of the cells. Mitotic MDCK cells round up and are extensively overlapped by neighbouring cells. (b–e) Knockdown of JAM-A results in mislocalization of PtdIns(3,4,5)P3. (b) Distribution of Akt-PH-GFP in JAM-A knockdown cells. MDCK cells stably expressing Akt-PH-GFP were transfected with control siRNAs (top set of panels) or JAM-A siRNAs (bottom set of panels) and mixed with wild-type MDCK cells. The localization of JAM-A (red), Akt-PH-GFP (green) and DNA (blue) was analysed by fluorescence microscopy. To visualize the distribution of Akt-PH-GFP along the XY axis, optical sections (Z=1 to Z=8) were taken at 0.36-μm intervals. Right panels: representative examples of mitotic control cells and JAM-A knockdown cells. Dotted lines indicate the positions of XZ sections shown in the left panels. It is noteworthy that in the JAM-A siRNA sample only the cell in the centre is depleted for JAM-A. Size bars, 5 μm. (c) Schematic illustration of cortical Akt-PH-GFP analysis using the TJs as apical and the sites of cell–matrix interaction as basal boundary of the lateral membrane domain. (d) Distribution of Akt-PH-GFP along the lateral membrane domain in control cells and JAM-A knockdown cells. (e) Quantitative analysis of metaphase cells with basal localization of Akt-PH-GFP. Statistical analyses were performed with unpaired Student's t-tests. Data are presented as means±s.e.m. from three independent experiments (d,e). ***P<0.001.

