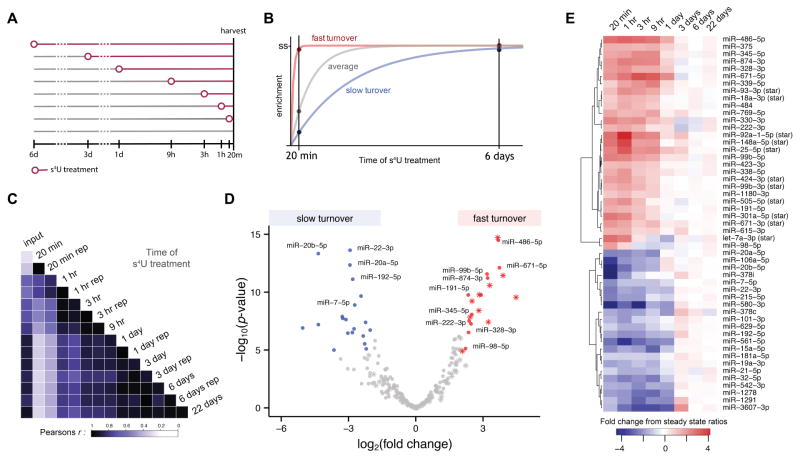
Figure 3. MTS chemistry reveals fast- and slow-turnover miRNAs in miRNA RATE-seq experiments.
(A) Schematic of s4U treatments used in miRNA RATE-seq. (B) Cartoon of anticipated behavior of fast-turnover and slow-turnover miRNAs in comparison to average. Fast-turnover miRNAs are expected to be over-represented in the early time points whereas slow-turnover miRNAs are depleted, relative to steady state (ss). (C) Heatmap depicting correlation coefficients (Pearson’s r) between miRNA levels at different times after s4U treatment. Replicate samples are indicated by (rep). (D) Volcano plot depicting results from a comparative analysis of miRNAs that are significantly enriched or depleted in early time points (20 min, 1 hr) relative to steady state levels (6 and 22 days). Fast-turnover miRNAs (fold difference early time points from steady state > 4; p-value < 2x10⁻⁵; Bonferroni family-wise error rate < 0.005) are colored red; slow-turnover miRNAs (fold difference early time points from steady state < 0.25; p-value < 2x10⁻⁵; Bonferroni family-wise error rate < 0.005) are shown in blue. Stars indicate miRNAs defined as miRNA-stars (see Experimental Procedures); the others are indicated with circles. (E) Heatmap indicating normalized miRNA enrichment relative to steady state level at each time point in RATE-seq for the fast- and slow-turnover miRNAs in (C). For clarity of presentation, the most significant fast-turnover miRNA in this analysis (miR-4521, log2(fold-change) = 10.8; p-value = 2.9x10−40) has been omitted from (C) and (D) due to values exceeding the indicated scales. See also Figure S5 and Table S2.

