Fig. 2.

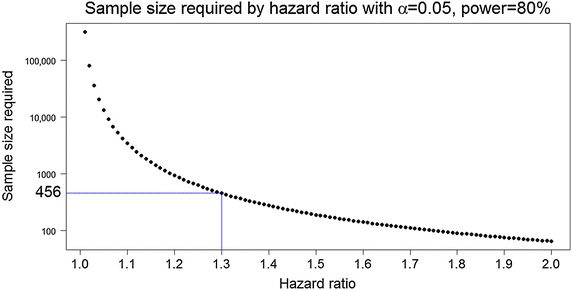
Graph showing the relationship between required hazard ratio and sample size. Sample size is plotted on a log scale (base 10). Significance (alpha, two-sided) = 0.05. Power = 80 %

Graph showing the relationship between required hazard ratio and sample size. Sample size is plotted on a log scale (base 10). Significance (alpha, two-sided) = 0.05. Power = 80 %