
Fig. 1.
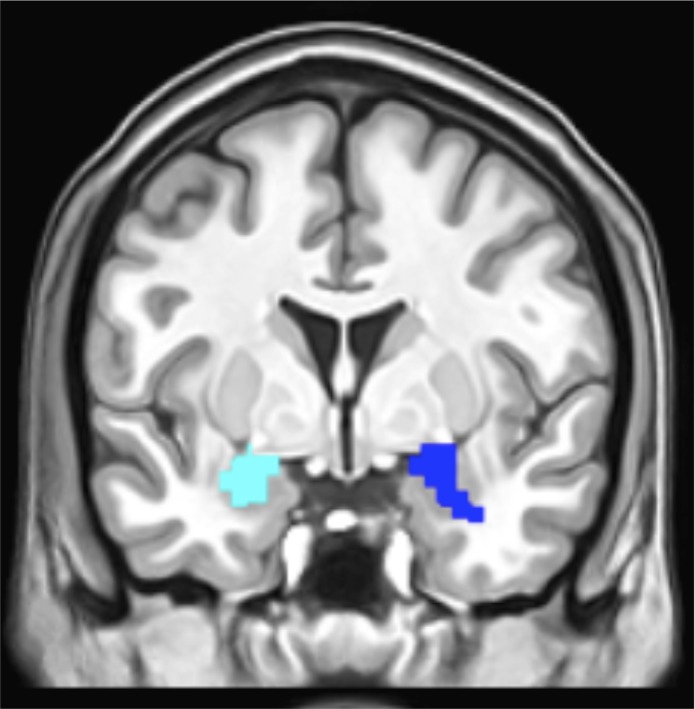
The final ROIs comprised areas of functional activity within anatomically defined amygdala masks. This figure shows the left amygdala ROI in pale blue and the right amygdala ROI in dark blue.
Official websites use .gov
A
.gov website belongs to an official
government organization in the United States.
Secure .gov websites use HTTPS
A lock (
) or https:// means you've safely
connected to the .gov website. Share sensitive
information only on official, secure websites.
The final ROIs comprised areas of functional activity within anatomically defined amygdala masks. This figure shows the left amygdala ROI in pale blue and the right amygdala ROI in dark blue.