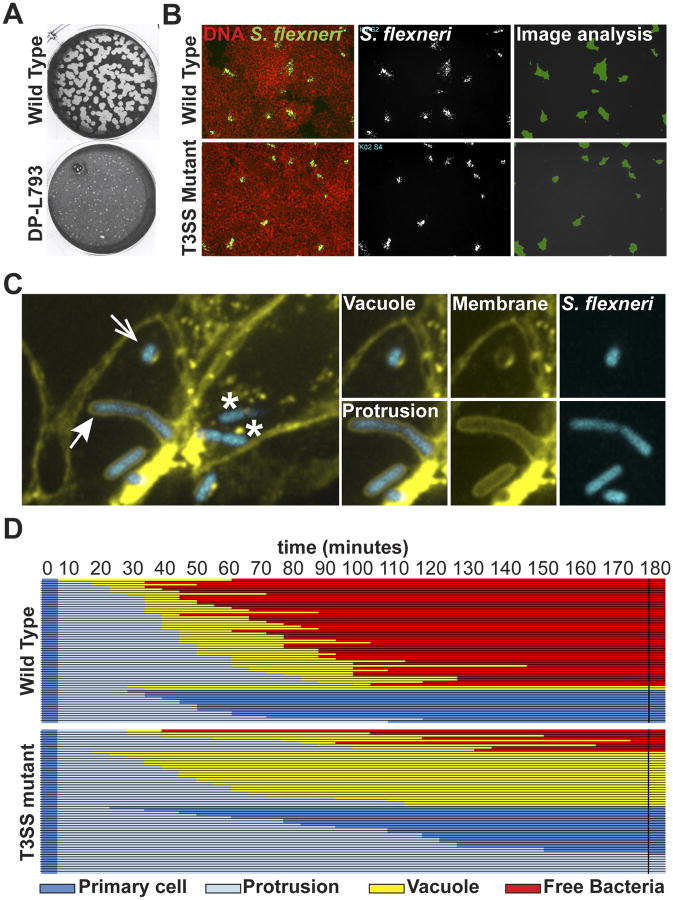
Figure 2. Readouts of bacterial spread from cell to cell.
(A) L. monocytogenes plaque assay depicting large (wild type) plaques, and a small plaque phenotype (DP-L793). Adapted from reference [7].
(B) Automated microscopy of S. flexneri infection in HT-29 cell monolayer. Left panels, overlay of DNA staining (red) and GFP (green)-expressing wild type and type III secretion system (T3SS) mutant strains. Middle panels: bacterial infection foci. Right panels: computer-assisted image analysis of infection foci size (green).
(C) High-magnification confocal microscopy showing features of bacterial spread form cell to cell in HT-29 cells expressing a fluorescent membrane marker (yellow) infected with S. flexneri (blue). Cytosolic bacteria in a primary infected cell (*) form membrane protrusions (closed arrow) that project into adjacent cells and resolve into secondary vacuoles (open arrow).
(D) Tracking analysis of 60 wild type (top) and T3SS mutant (bottom) strains. Each line represents one bacterium that was tracked for 180 minutes and the progression of the dissemination process is depicted using the color key shown at the bottom. Primary cell, dark blue; Protrusion, light blue; Vacuole, yellow; Free bacteria in adjacent cell, red. The data shows that 75% of the wild type bacteria succeed in forming protrusions that resolve into vacuoles from which the bacteria escape (free). By contrast, the majority of the T3SS mutant bacteria either form protrusions that fail to resolve into vacuoles and retract to the primary infected cell, or fails to escape the formed vacuole. Adapted from reference [18].

