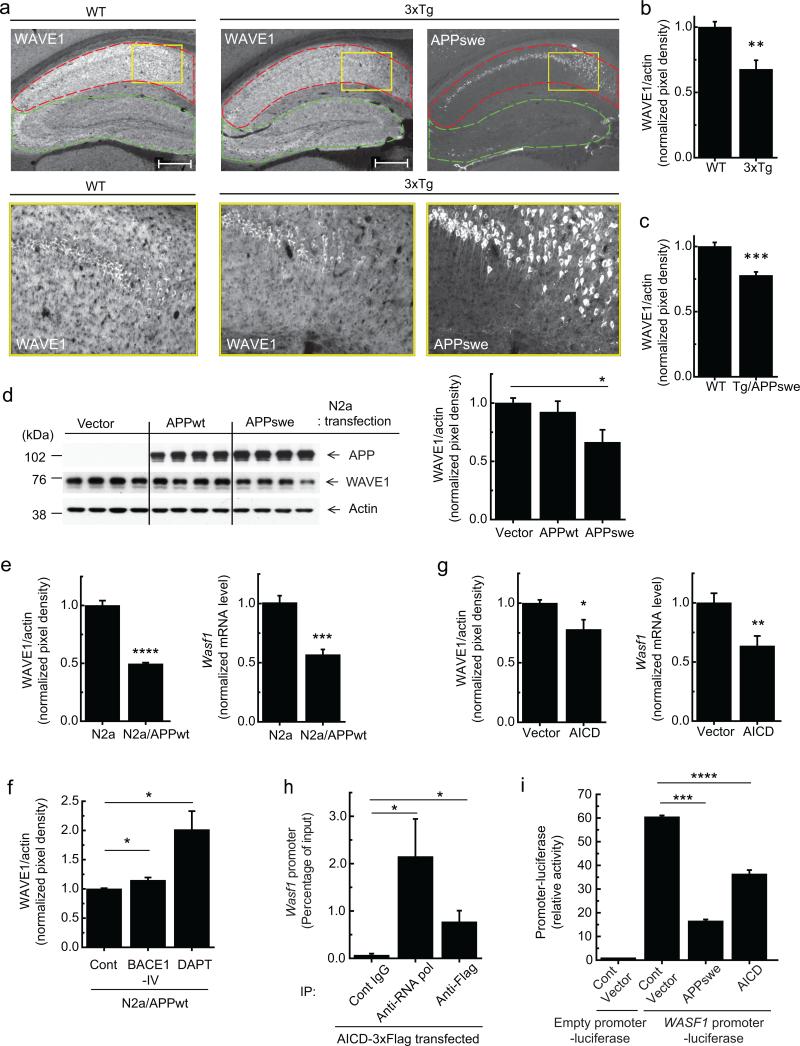
Figure 1.
Downregulation of WAVE1 expression by overexpression of APP or AICD. (a) Immunohistochemistry of WAVE1 and APPswe in 12 month-old WT and 3xTg male mice. High magnification images (bottom) of the rectangular regions (yellow) in top images. CA1 (red), and CA2, CA3 and dentate gyrus (green). Scale bars, 500 μm. (b, c) Immunoblotting of WAVE1 and actin in the hippocampus from 12 month-old WT (n = 4) and 3xTg (n = 8) (b) or 8 month-old WT (n = 10) and Tg/APPswe (n = 10) (c) male mice. The quantified protein level of WAVE1 was normalized to the level of actin. (d) N2a cells were transiently transfected as indicated. Representative immunoblotting images (left), and quantification (right, n = 5). (e) WAVE1 protein (left, n = 6) and mRNA (right, n = 6) levels in normal N2a and N2a/APPwt cells. (f) Effect of the β-secretase (BACE1-IV) or γ-secretase (DAPT) inhibitors on WAVE1 protein level in N2a/APPwt cells (Cont and BACE1-IV, n = 6; DAPT, n = 8). (g) WAVE1 protein (left, n = 4) and mRNA (right, n = 6) levels in N2a cells transiently transfected with AICD. (h) ChIP analysis of N2a cells transiently transfected with 3xFlag-tagged AICD. Immunoprecipitation (IP) was performed with preimmune (Cont) IgG, anti-RNA polymerase antibody (anti-RNA pol) as a positive control, or anti-Flag antibody. A fragment of the Wasf1 gene promoter in the immune complex was amplified by PCR and quantified (n = 9). (i) N2a cells were transiently co-transfected as indicated. Luciferase activity was measured (n = 6). Means ± SEM. *P < 0.05, **P < 0.01, ***P < 0.001 and ****P < 0.0001, two-tailed t-test.

