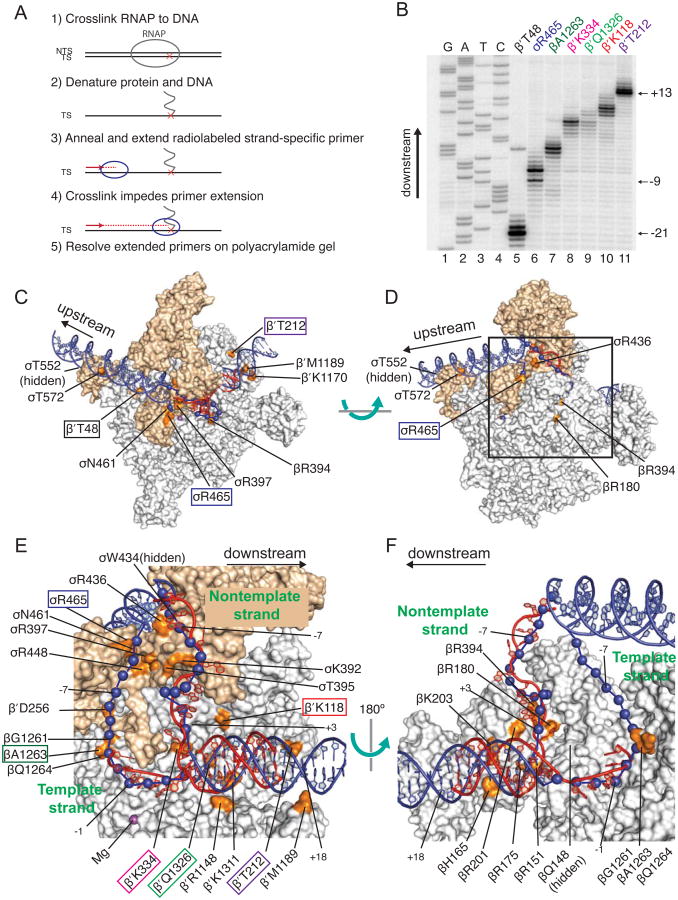
Figure 2. DNA Path in RPO Determined by Bpa Crosslinking and Computational Modeling Agrees with RNAP-DNA X-ray Structures.
(A) Schematic diagram of primer extension mapping of crosslinks to DNA. (B) Representative gel showing primer extension analysis using a primer annealing to the template strand. Lanes 1-4, sequencing ladder; lanes 5-11, extension products generated from crosslinks to the indicated Bpa-RNAP. (C-F) Surface representations of E. coli RNAP holoenzyme (Bae et al., 2013; PDB 4LJZ) with downstream fork-junction DNA (Zhang et al., 2012; PDB 4G7Z) in red ribbon (non-template strand DNA from -12 to +12 and template strand DNA from -4 to +12). The double-stranded DNA regions (blue ribbon) and single-stranded DNA regions (blue spheres) were positioned computationally using the crosslinks as constraints (see Experimental procedures). The E. coli RNAP and T. thermophilus RNAP coordinates from the PDB database were aligned, and the T. thermophilus RNAP was hidden from view. Residues in RNAP where Bpa substitutions crosslinked to promoter DNA are shown in orange and labeled. Labels of the Bpa residues used in the experiment in panel B are boxed. σ is tan, α, β, β′, and ω are gray. The wild-type amino acids are illustrated, not Bpa. (C-D) Overall views of RPO model rotated by ∼90°. Box in (D) indicates area sh own in close-ups in (E-F). Expanded view of single-stranded DNA and downstream duplex DNA. (E) β′ and σ70 are shown, but most of β is eliminated for clarity. (F) β is shown, but β′ and σ are eliminated for clarity. The complex is rotated 180° from the view in (E). T emplate strand positions -12 to -5 were not present in this crystal structure. Model was generated from footprinting and crosslinking data provided in Figure S2 and Table S2. Table S3 compares the DNA-RNAP interactions in our RPO model derived from Bpa crosslinking to those from the X-ray structure (Zhang et al., 2012). A few DNA positions are numbered for orientation purposes. Related to Figures S1, S2, and S5, and Tables S2 and S3.

