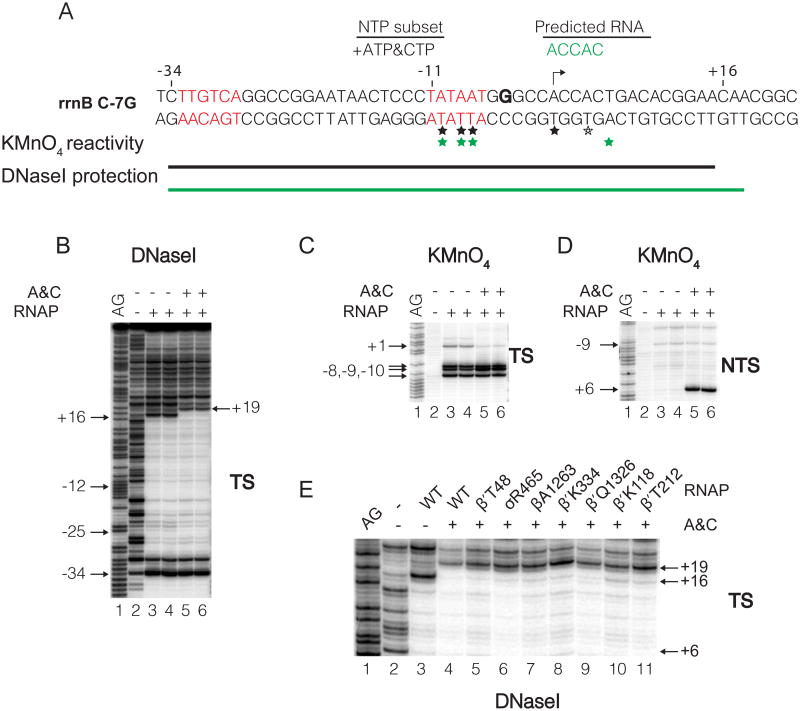
Figure 3. Formation of open and initial transcribing complexes at the rrnB C-7G promoter.
(A) Sequence and footprinting summary of complexes formed by the rrnB C-7G promoter. rrnB C-7G differs from wild-type rrnB P1 at only one position, a C to G change 2 bp downstream from the -10 hexamer (Haugen et al., 2006). Transcription start site (arrow). The -35 and -10 hexamers are in red. ACCAC (green): expected transcript formed with ATP and CTP. Thymines reactive with KMnO4 in the absence (black asterisk) or presence (green asterisk) of ATP and CTP. Template strand region protected from DNase I in complexes formed with no ATP, CTP (RPo; black line) or with ATP, CTP (RPITC; green line). DNase I (B) or KMnO4 (C,D) footprints of complexes formed with or without ATP and CTP. Lanes 1, A+G sequence ladder. The DNA fragment was 3′ end-radiolabeled on the template strand (TS) or the non-template strand (NTS). (E) DNase I footprints of RPo formed with wild-type RNAP (lane 3) or RPITC5 formed with wild-type or BPA-containing RNAPs in the presence of ATP, CTP (lanes 4-11). Downstream edge of DNaseI footprints is at +16 for RPo (lane 3), or at +19 for RPITC5 (lanes 4-11). Footprinting data for the other 26 RNAPs analyzed are in Figure S3.

