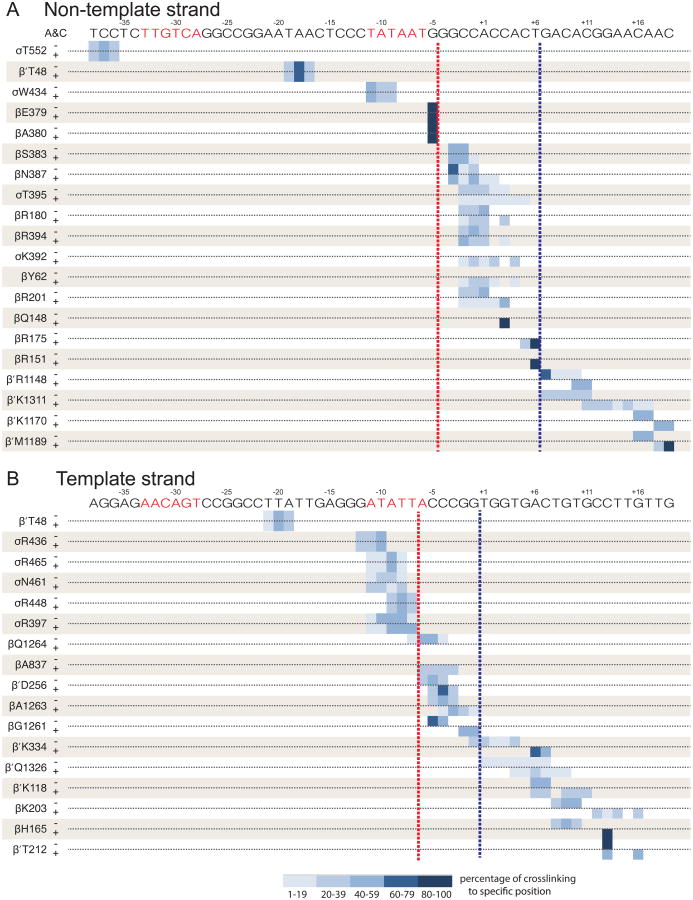
Figure 5. Summary of rrnB C-7G RPO and RPITC crosslinking data.
Positions of crosslinks to the non-template strand (A) or the template strand (B) for each of 36 Bpa-RNAPs (listed to left of panels). β′T48-Bpa crosslinks to both strands. DNA sequences are shown above each panel. Crosslink positions in RPo (- A&C) and RPITC5 (+A&C) are illustrated by blue-shaded bars for each crosslinked nucleotide position. The fraction of crosslinking for each position is indicated by color shading intensity (key at bottom of figure). Crosslink patterns for RPO and RPITC5 are identical for positions upstream of the red dotted line (i.e. upstream of the scrunched bulges), become different between the red and blue dotted lines (the region containing the bulge), and are shifted by ∼3 nt downstream of the blue dotted lines (the region pulled into the enzyme after nucleotide addition). The data on which Figure 5 is based are shown in Figures 4, S4, and Table S2.

