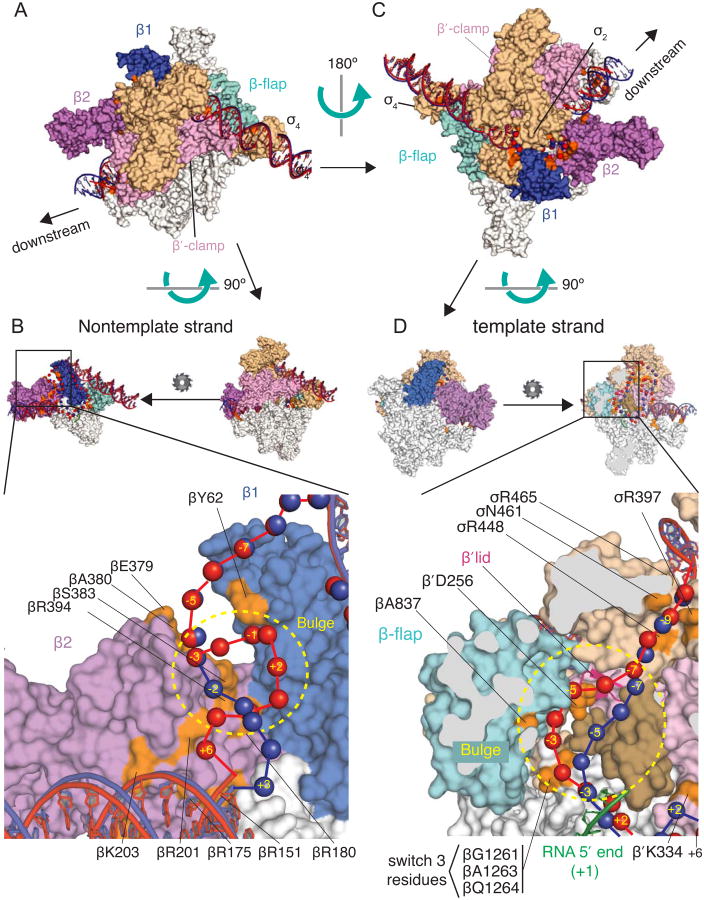
Figure 6. Computational Model of the DNA path in the scrunched complex RPITC5 based on crosslink data.
The model was constructed using an E. coli RNAP holoenzyme structure (Bae et al., 2013; PDB 4LJZ). (A) and (C) Two overviews of the RPO and RPITC5 models, rotated by ∼180 degrees. (B) and (D) Expanded views of regions with proposed locations of non-template strand (B) or template strand (D) bulges in the scrunched DNA. In (B), the small diagrams show that the view in (A) has been rotated to view the enzyme from the β′ side, and β′ and σ are hidden. In (D), the view from (C) is rotated 90 degrees and then β is sliced (grey areas) to reveal the main channel. RNAP subunits are white, except β1 is blue, β2 is purple, the β flap is cyan, the β′ clamp is pink, and the β′ lid is dark pink ribbon. σ70 is tan, with region 3.2 in dark tan. Amino acid positions where Bpa substitutions crosslinked to DNA are in orange. Upstream or downstream duplex DNA is shown in ribbon form, and single-stranded residues are shown as spheres (blue for RPO or red for RPITC5). The RNA 5-mer in RPITC5 is green (position aligned using X-ray structure (Basu et al., 2014).

