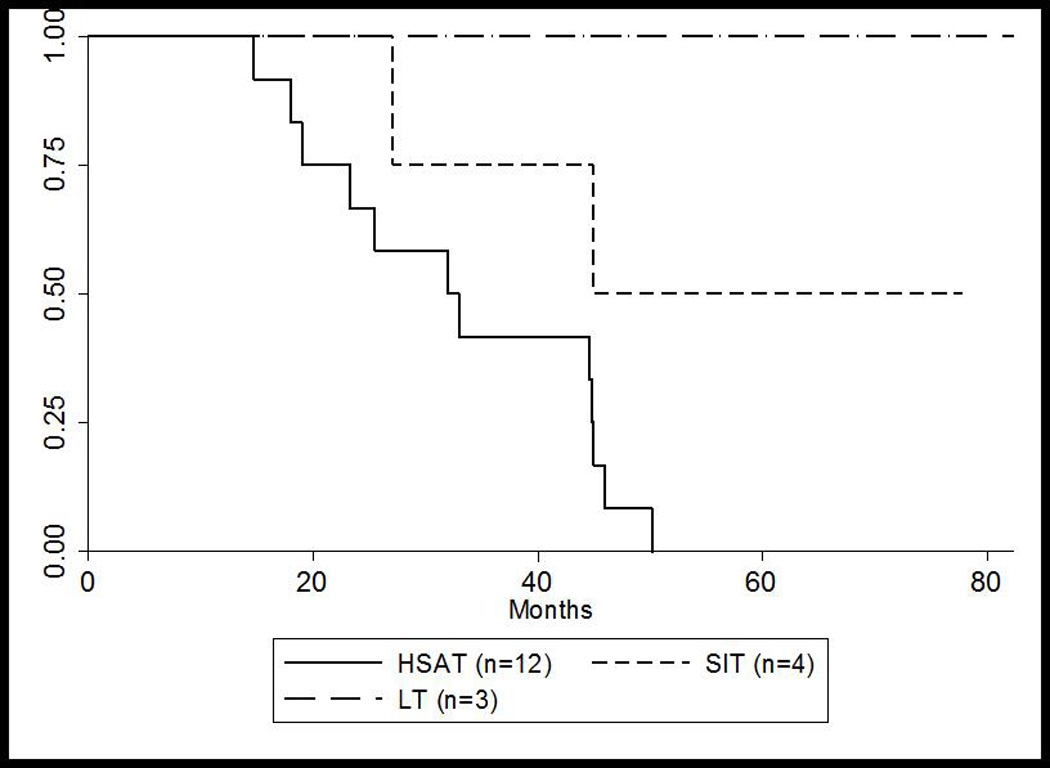
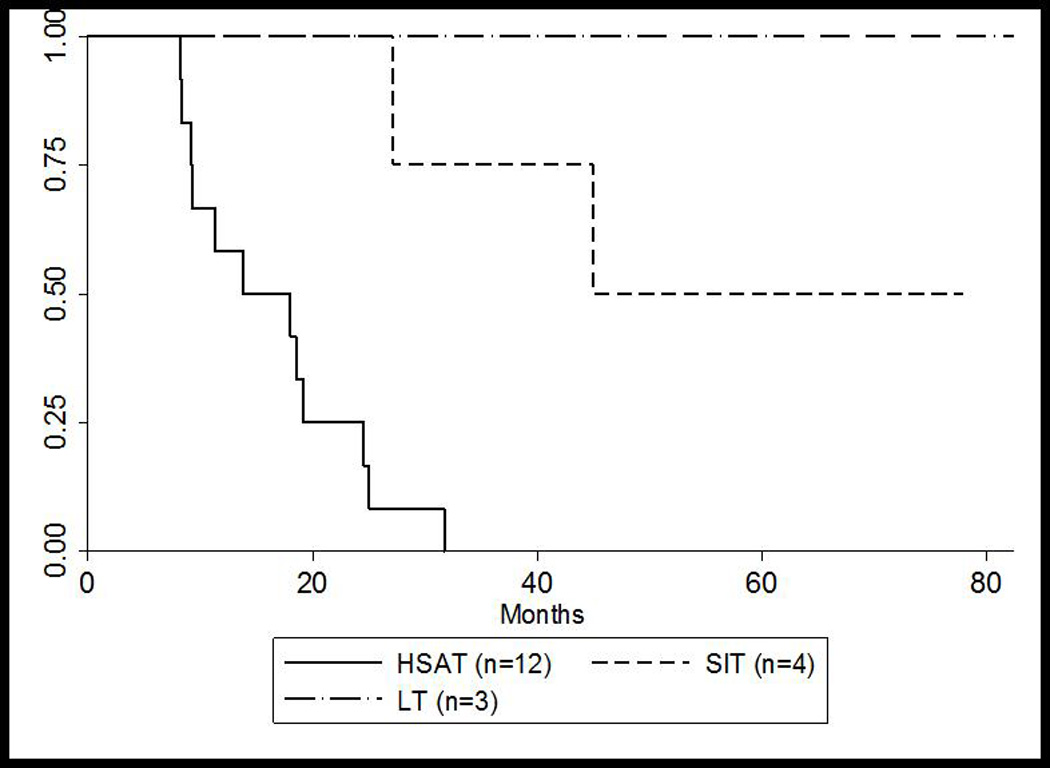
Figure 2. Kaplan-Meier Curves* for (A) overall survival and (B) ventilator-free survival for HSAT, SIT, and LT groups.


(A) Overall survival for HSAT, SIT, and LT groups
(B) Invasive ventilator-free survival for HSAT, SIT, and LT groups
* Patient 10 was successfully rescued using ITI at 86 weeks and was excluded in these calculations
HSAT, high sustained antibody titers; LT, low titers; SIT, sustained intermediate titers
