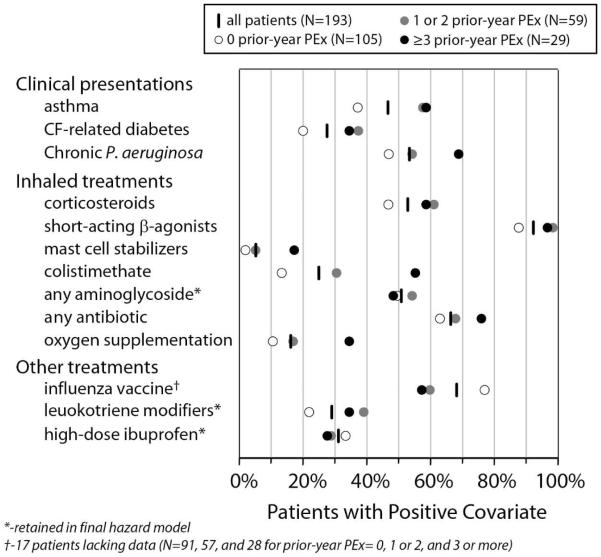
Figure 4. Covariate distributions by Prior-year PEx subgroup.
Percentages of all patients (vertical dashes), and Prior-year PEx patient subgroups (circles) in which categorical covariates included in Cox proportional hazards regression (Figure 1) were positive.

