
Figure 4.
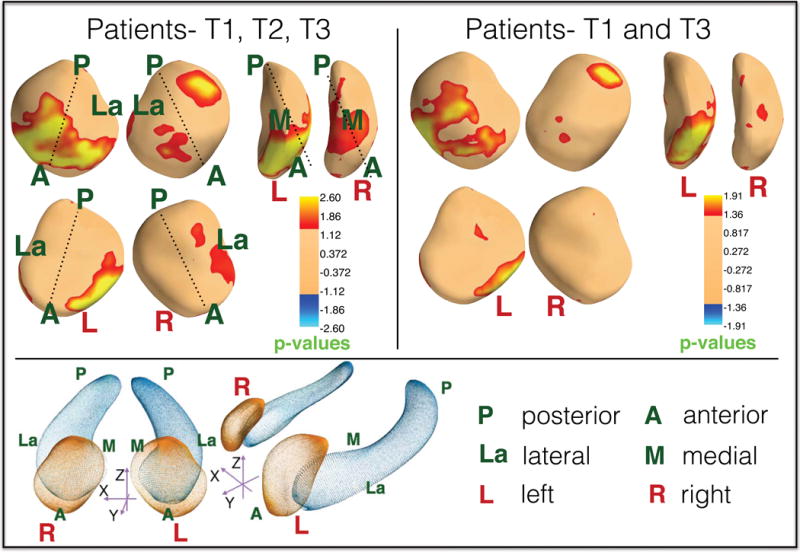
Longitudinal effect of ECT on local amygdalar shape. Top left panel shows significant local bilateral expansion in the dorsomedial amygdala as well as the left basolateral amygdala in patients across treatment time points. Top right panel shows significant expansions in the left basolateral amygdala in patients at T3 compared to T1. P-values are corrected for FDR (37) (q=0.05). The bottom panel shows the surface anatomy of the amygdala and hippocampus along with labeled orientations.