
Figure 5.
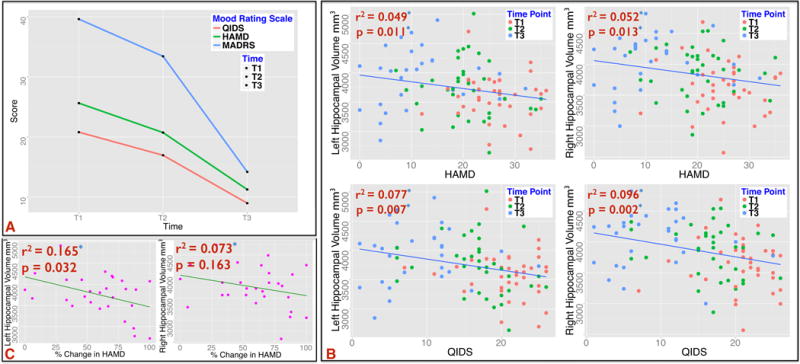
A: Treatment effect of ECT on mood scores; HAM-D, F(2, 29.62) = 35.99, p < .0001, QIDS-SR scores, F(2, 29.44) = 50.03, p < .0001 and MADRS, F(2, 29.08) = 47.5, p < .0001. B: Significant associations of hippocampal (top) and amygdala (bottom) volumes with improvement in mood scores across all time points T1, T2 and T3. C: Association of baseline volumes of the hippocampus and change in clinical response over the course of ECT. The left hippocampus is significantly correlated with improvement in percentage change in HAMD between T1 and T3.