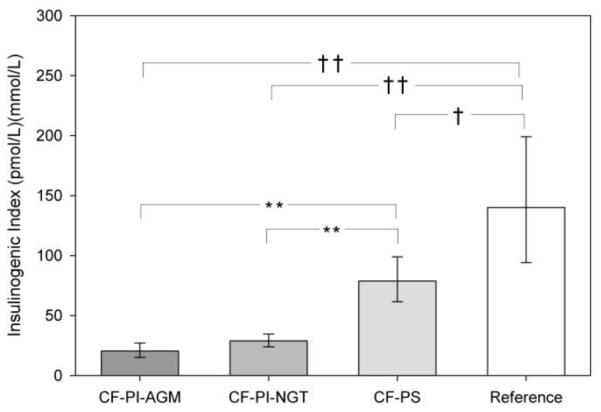
Figure 1.

Insulinogenic index results in patients with CF-PS, CF-PI-NGT, CF-PI-AGM, and reference group during OGTT. Tests for differences between group means were performed in an ANOVA model. Reference group compared to CF-PS and CF-PI- † p<0.05, †† p<0.001. CF-PS group compared to reference and CF-PI groups- ** p<0.001
