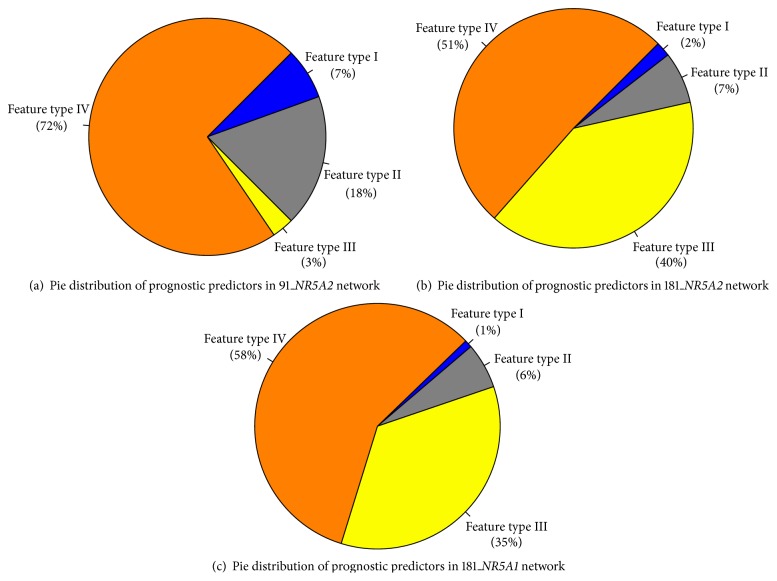
Figure 4.
Pie distribution for four subpools of prognostic predictors from the networks of NR5A2 and NR5A1. (a, b) Pie distribution for four subpools of classified prognostic predictors derived from the networks of NR5A2 in two selected populations. Two cohort relevant networks of NR5A2 (91A cohort and 181A cohort) identify 131 probes and 302 probes to be the potential prognostic factors in the 91A and 181A cohort, respectively. The pie distribution illustrates four classified prognostic predictor subpools derived from overlapping between the cohort relevant network of NR5A2 and four types of prognostic indicators in three selected populations (91A cohort, 90A cohort, and 181A cohort). (a) The four feature types follow an order of type IV > type II > type III > type I. (b) Four feature types follow an order of type IV > type III > type II > type I. (c) Four subpools of classified prognostic predictors derived from the networks of NR5A1 in 181A cohort; the 181A cohort relevant network of NR5A1 predicts 1,334 probes to be the potential prognostic factors in 181A cohort. The feature type distribution follows an order of type IV > type III > type II > type I.

