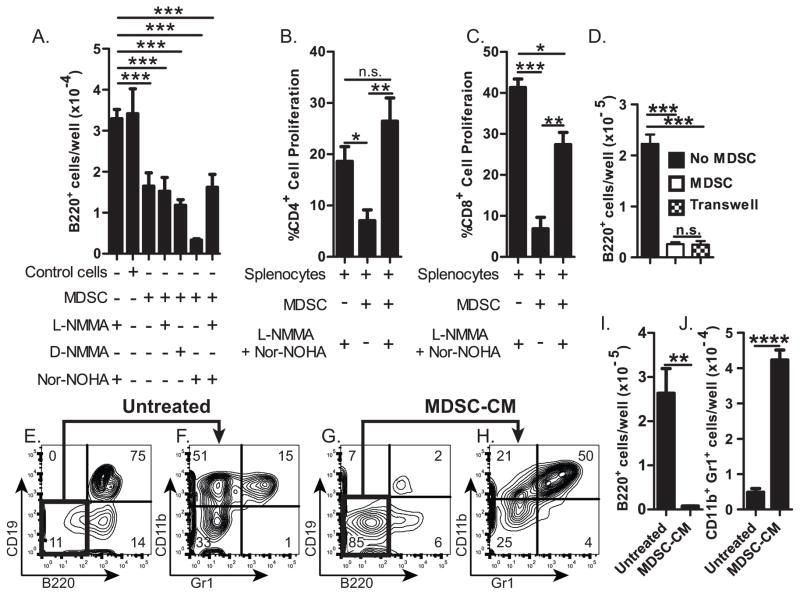
Figure 4. Inhibition of B-lymphopoiesis by MDSC soluble factor(s).
(A) Number or B220+ cells resulting from B-lymphopoiesis cultures containing ACM-generated MDSCs (CD11bhi Gr1+) or control CD11b+Gr1+ cells, with or without 0.3mM L-NMMA, D-NMMA, and/or Nor-NOHA. (B&C) Percentage of proliferating (B) CD4+ or (C) CD8+ splenocytes after in vitro activation with anti-CD3 and anti-CD28 cultured with (or without) ACM-generated MDSCs in the presence (or absence) of L-NMMA & Nor-NOHA (0.3mM). (D) Number of B220+ cells in B-lymphopoiesis cultures without MDSCs (■); with MDSCs (□); or with MDSCs in transwell (
 ). (E–J) B-lymphopoiesis assays performed in the presence (or absence [untreated]) of MDSC-conditioned medium. Flow cytometric analysis (E – H) of cells stained with (E and G) anti-B220 and anti-CD19, or (F and H) with anti-Gr1 and anti-CD11b; Number of (I) B220+ cells or (J) CD11b+Gr1+ cells resulting from these cultures. Error bars show average of triplicate wells ± SD. Data are representative of three independent experiments, except for D which is representative of two experiments. Statistical significance for data in panel A were analyzed by ANOVA in combination with Dunnet’s multiple comparison test; p<0.0001. Data in B–D were analyzed by ANOVA in combination with Bonferroni’s multiple comparison test; p=0.001, p=0.003; p<0.0001, respectively. Similar statistical significance was found in each of two or three independent experiments.

